Fig. 4.
Download original image
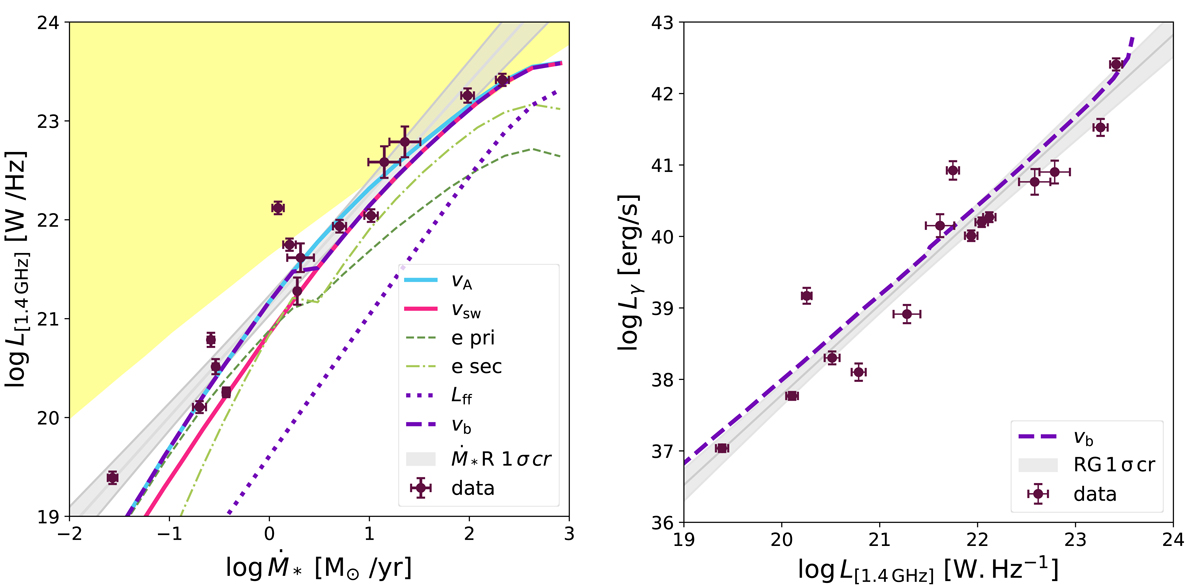
Results for scenario (0) using vadv = vb from Eq. (15) (violet dashed line). Left panel: L1.4 GHz–SFR relation. The green dashed and dot-dashed lines represent the primary and secondary synchrotron electron contribution, respectively, and the dotted violet line the free-free contribution. The total emission at L1.4 GHz is also shown for two different prescriptions for vadv, vA (solid blue line) and vsw (solid pink line). Right panel: Lγ–L1.4 GHz relation. In both panels the grey shaded band indicates the 1σ confidence region of each fit (solid grey line) to the data sample (purple points).
Current usage metrics show cumulative count of Article Views (full-text article views including HTML views, PDF and ePub downloads, according to the available data) and Abstracts Views on Vision4Press platform.
Data correspond to usage on the plateform after 2015. The current usage metrics is available 48-96 hours after online publication and is updated daily on week days.
Initial download of the metrics may take a while.