Fig. 3.
Download original image
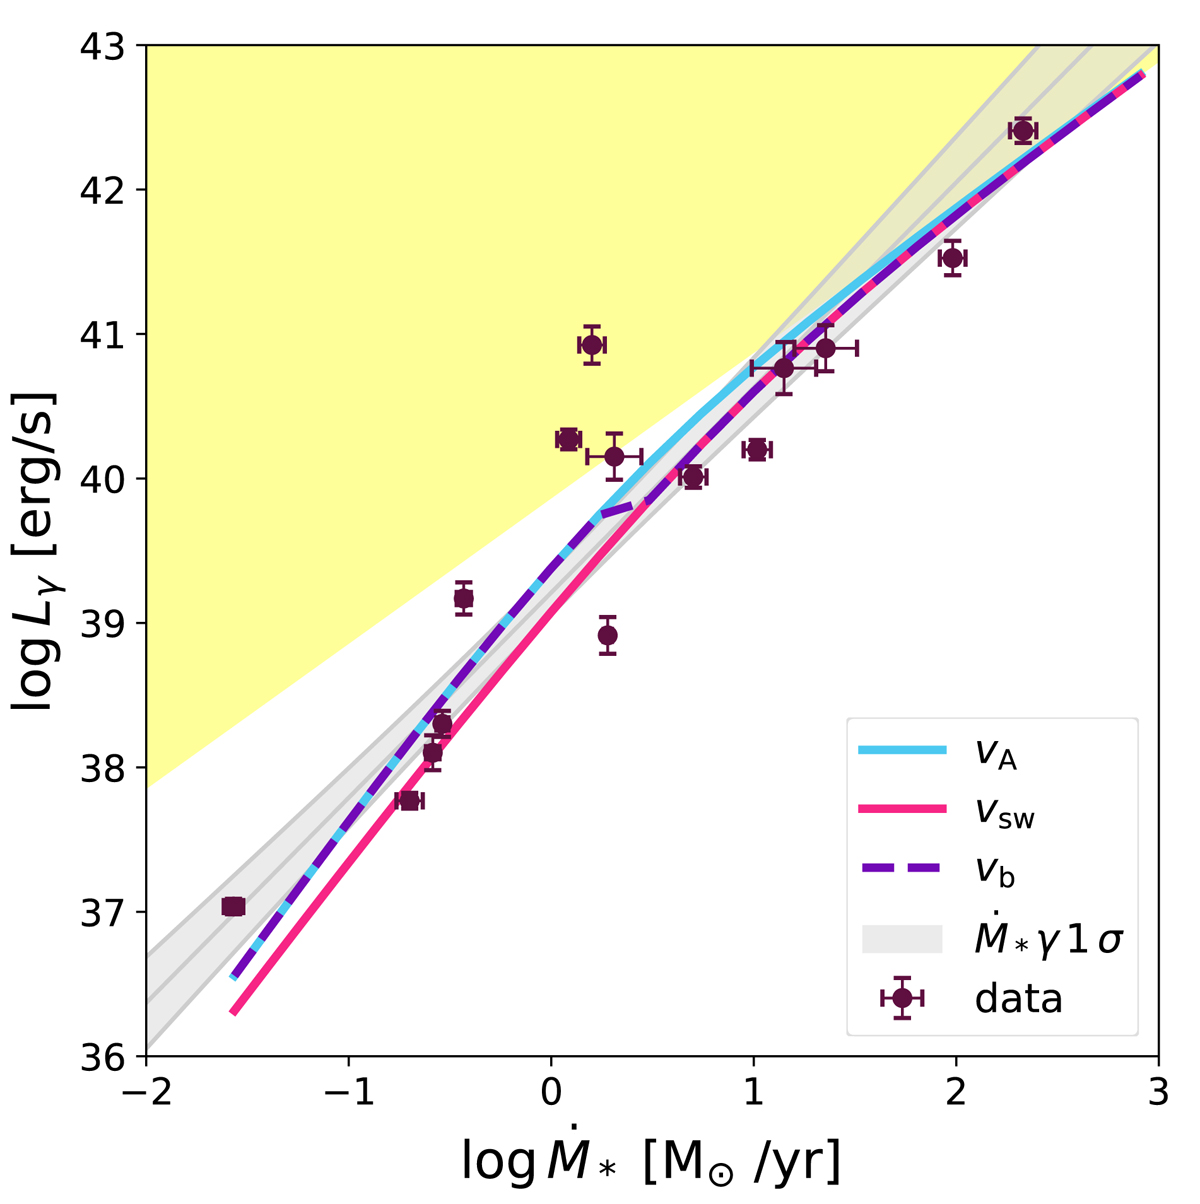
Lγ–SFR relation for scenario (0) using three different prescriptions for vadv: va (solid blue line), vsw (solid pink line), and vb from Eq. (15) (violet dashed line). The grey line and shaded band indicate the best fit to the data (purple circles) and its 1σ confidence region, respectively. The yellow region is forbidden by the calorimetric limit.
Current usage metrics show cumulative count of Article Views (full-text article views including HTML views, PDF and ePub downloads, according to the available data) and Abstracts Views on Vision4Press platform.
Data correspond to usage on the plateform after 2015. The current usage metrics is available 48-96 hours after online publication and is updated daily on week days.
Initial download of the metrics may take a while.