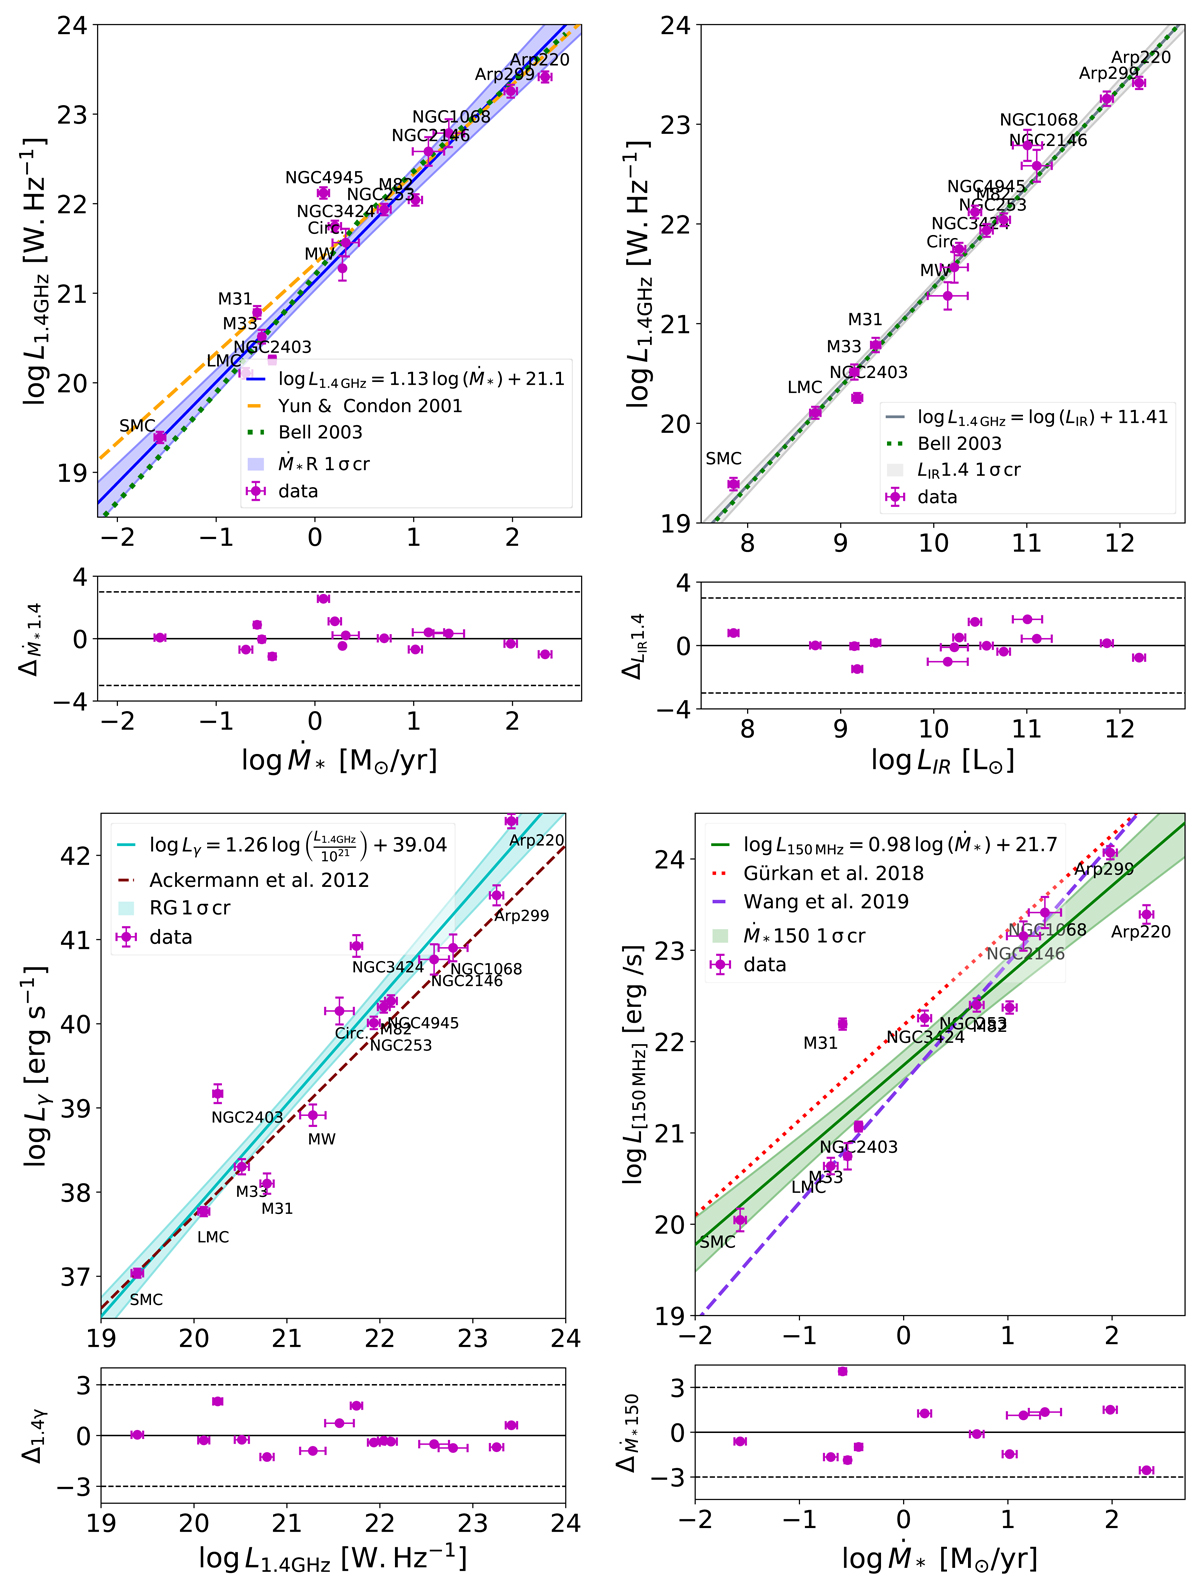
Fig. 1.
Download original image
Observed correlations for our galaxy sample. Upper left panel: L1.4 GHz as a function of the SFR. The blue solid line is the best fit to the data, and the shaded region its 68% confidence level. For comparison, the yellow dashed and green dotted lines show the Yun et al. (2001) and Bell (2003) relations, respectively. Upper right panel: L1.4 GHz as a function of LIR. The grey solid line is the best fit to the data, and the shaded region its 68% confidence level. For comparison, the green dotted line shows the Bell (2003) relation. Lower left panel: Lγ as a function of L1.4 GHz. The cyan solid line shows the best fit to the data, and the shaded region its 68% confidence level. For comparison, the brown dashed line shows the Ackermann et al. (2012) relation. Lower right panel: L150 MHz as a function of the SFR. The green solid line is the best fit to the data, and the shaded region its 68% confidence level. For comparison, the red dotted and violet dashed lines show the Gürkan et al. (2018) and Wang et al. (2019) relations, respectively. In all cases, the corresponding residuals weighted by their standard deviation are shown in the bottom panel; the black dotted lines correspond to 3σ.
Current usage metrics show cumulative count of Article Views (full-text article views including HTML views, PDF and ePub downloads, according to the available data) and Abstracts Views on Vision4Press platform.
Data correspond to usage on the plateform after 2015. The current usage metrics is available 48-96 hours after online publication and is updated daily on week days.
Initial download of the metrics may take a while.