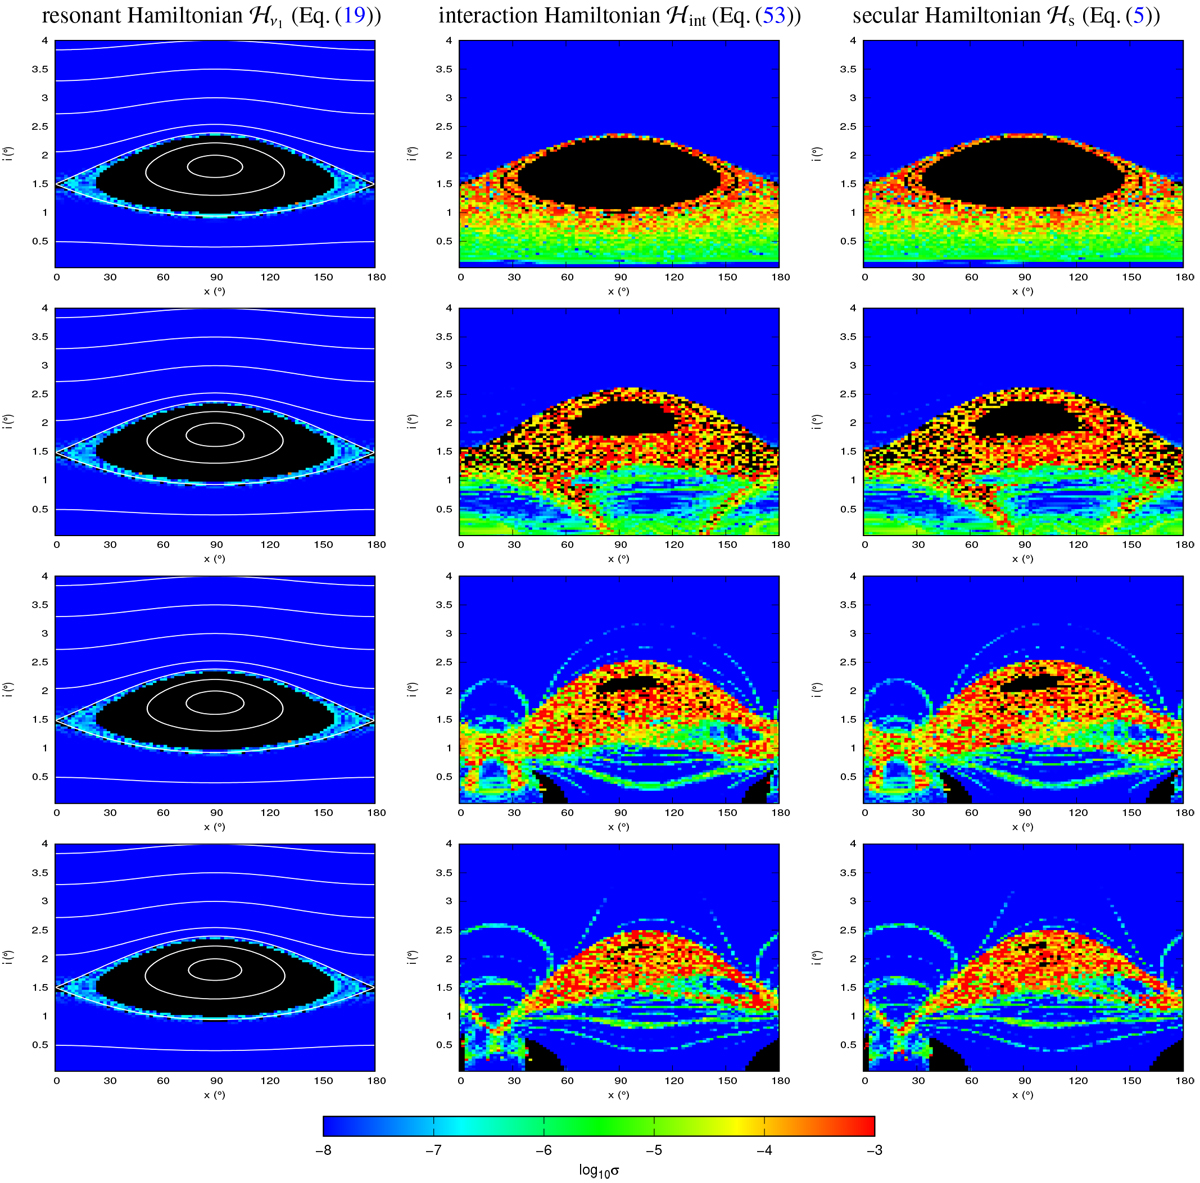
Fig. 7
Download original image
Stability maps for Phobos (Table 1) using an obliquity for Mars ε = 90°. From top to bottom, the initial eccentricity is e = 10−5, e = 0.015, e = 0.03, e = 0.045. Each column corresponds to the integration using different Hamiltonians: resonant Hamiltonian (left), interaction Hamiltonian (middle) and the full secular Hamiltonian (right). The color scale indicates the value of the quantity log10 σ. The blue and green areas correspond to stable circulating trajectories, while the yellow, orange, and red ones correspond to chaotic motions. The black areas correspond to stable resonant regions, for which log10 θ < −3.9.
Current usage metrics show cumulative count of Article Views (full-text article views including HTML views, PDF and ePub downloads, according to the available data) and Abstracts Views on Vision4Press platform.
Data correspond to usage on the plateform after 2015. The current usage metrics is available 48-96 hours after online publication and is updated daily on week days.
Initial download of the metrics may take a while.