Fig. 5
Download original image
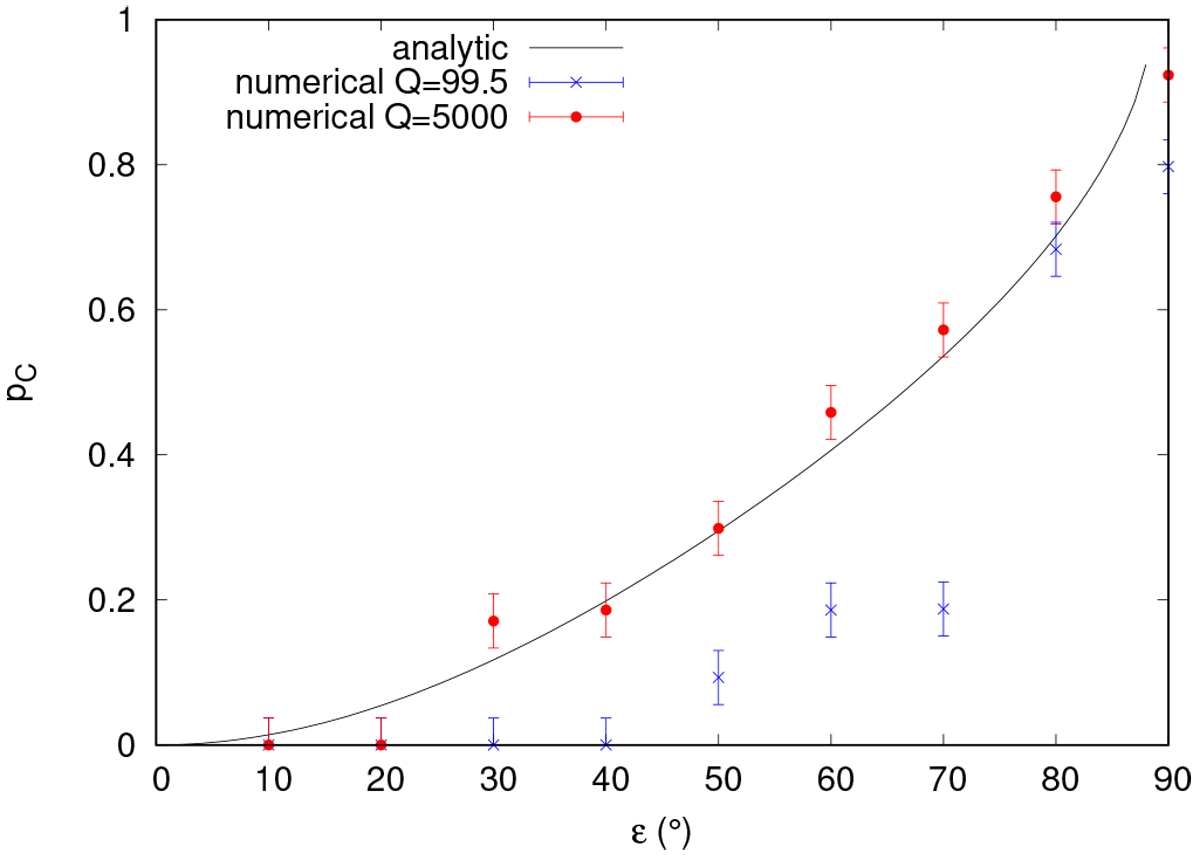
Capture probability of Phobos in the ν1 resonance with respect to the obliquity of Mars. The black curve corresponds to the capture probability computed with Eq. (52). The blue crosses and the red dots correspond to the capture probability determined for each value of the obliquity with N = 720 numericalintegrations of the resonant Hamiltonian (Eq. (19)), respectively with Q = 99.5 and Q = 5000 for the effective specific tidal dissipation. The errorbars are given by ![]() .
.
Current usage metrics show cumulative count of Article Views (full-text article views including HTML views, PDF and ePub downloads, according to the available data) and Abstracts Views on Vision4Press platform.
Data correspond to usage on the plateform after 2015. The current usage metrics is available 48-96 hours after online publication and is updated daily on week days.
Initial download of the metrics may take a while.