Fig. 7.
Download original image
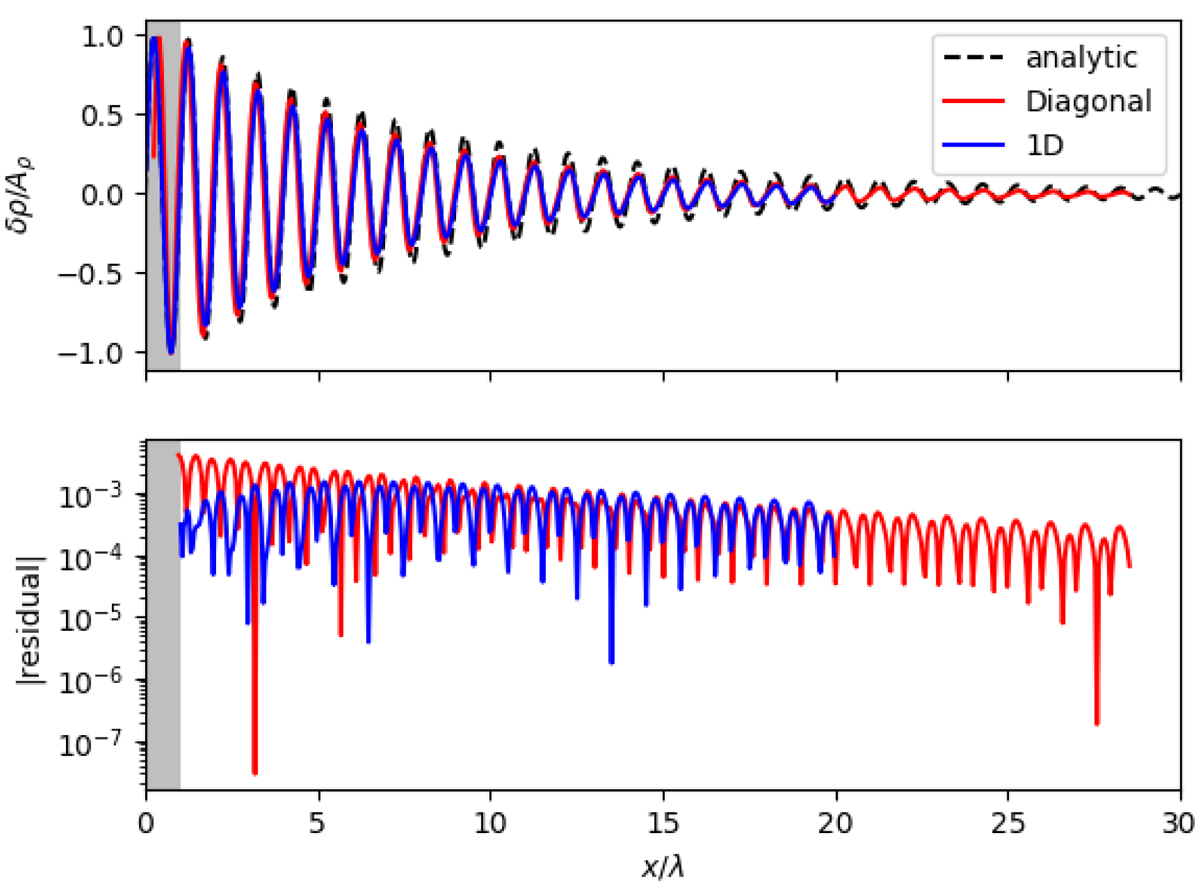
Comparison between 1D and 2D numerical solutions of the RHD wave. Top panel: density perturbation profile of an RHD wave after 40 oscillation periods. In black, the analytically predicted profile, in blue results from a 1D simulation and in red results from a 2D simulation with the wave vector parallel to the first diagonal. The x-axis is here chosen in the direction of the wave vector. Bottom panel: respective residuals calculated as |ρ − ρanalytic|/ρanalytic, where the analytic density is calculated from perturbation theory.
Current usage metrics show cumulative count of Article Views (full-text article views including HTML views, PDF and ePub downloads, according to the available data) and Abstracts Views on Vision4Press platform.
Data correspond to usage on the plateform after 2015. The current usage metrics is available 48-96 hours after online publication and is updated daily on week days.
Initial download of the metrics may take a while.