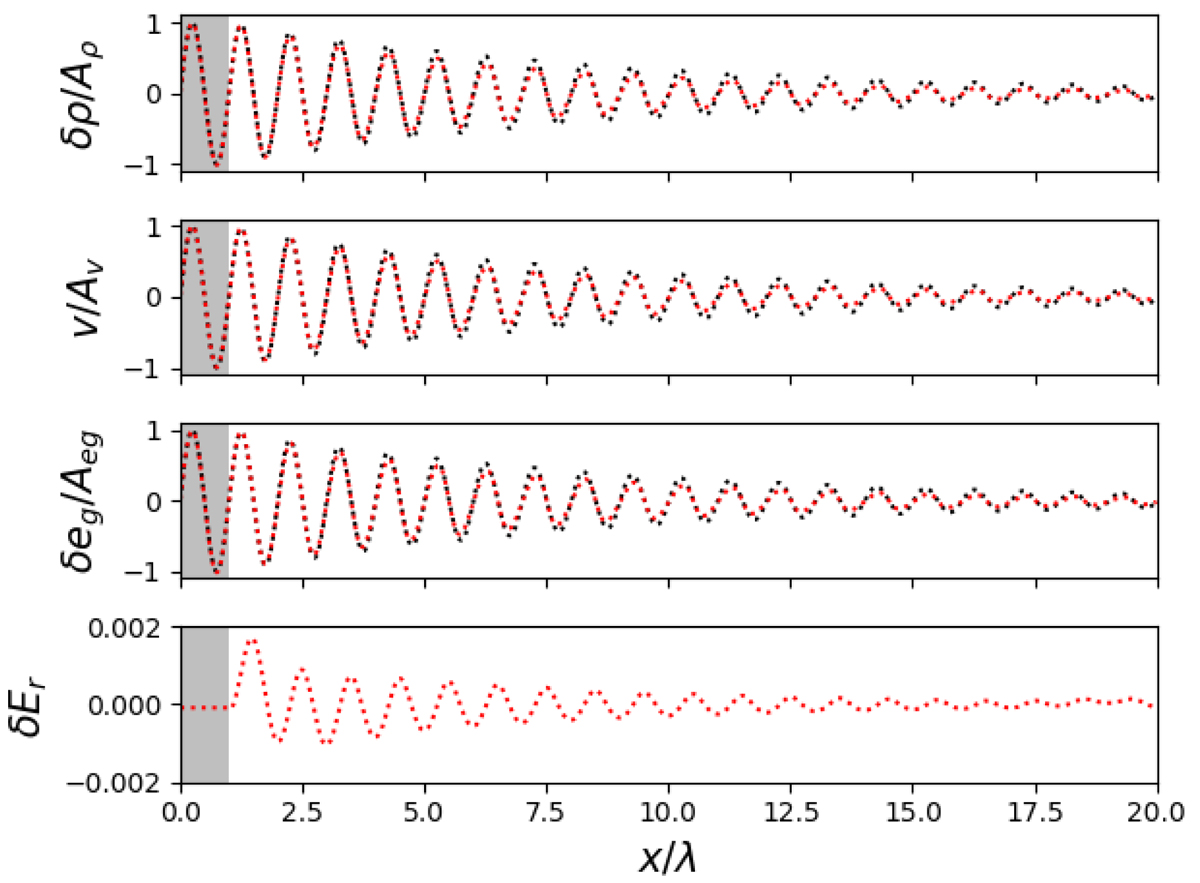
Fig. 6.
Download original image
Comparison between numerical and analytical solutions of the RHD wave. From top to bottom: the density perturbation, velocity, gas energy perturbation, and radiation energy perturbation after 40 oscillation periods, for an RHD wave where the optical thickness of a wavelength is equal to 1000. For the top three panels, this is compared to the analytic profile (black dotted lines) that is calculated as described by Mihalas & Mihalas (1984). The wave is driven from the grey shaded area on the left side of the plot.
Current usage metrics show cumulative count of Article Views (full-text article views including HTML views, PDF and ePub downloads, according to the available data) and Abstracts Views on Vision4Press platform.
Data correspond to usage on the plateform after 2015. The current usage metrics is available 48-96 hours after online publication and is updated daily on week days.
Initial download of the metrics may take a while.