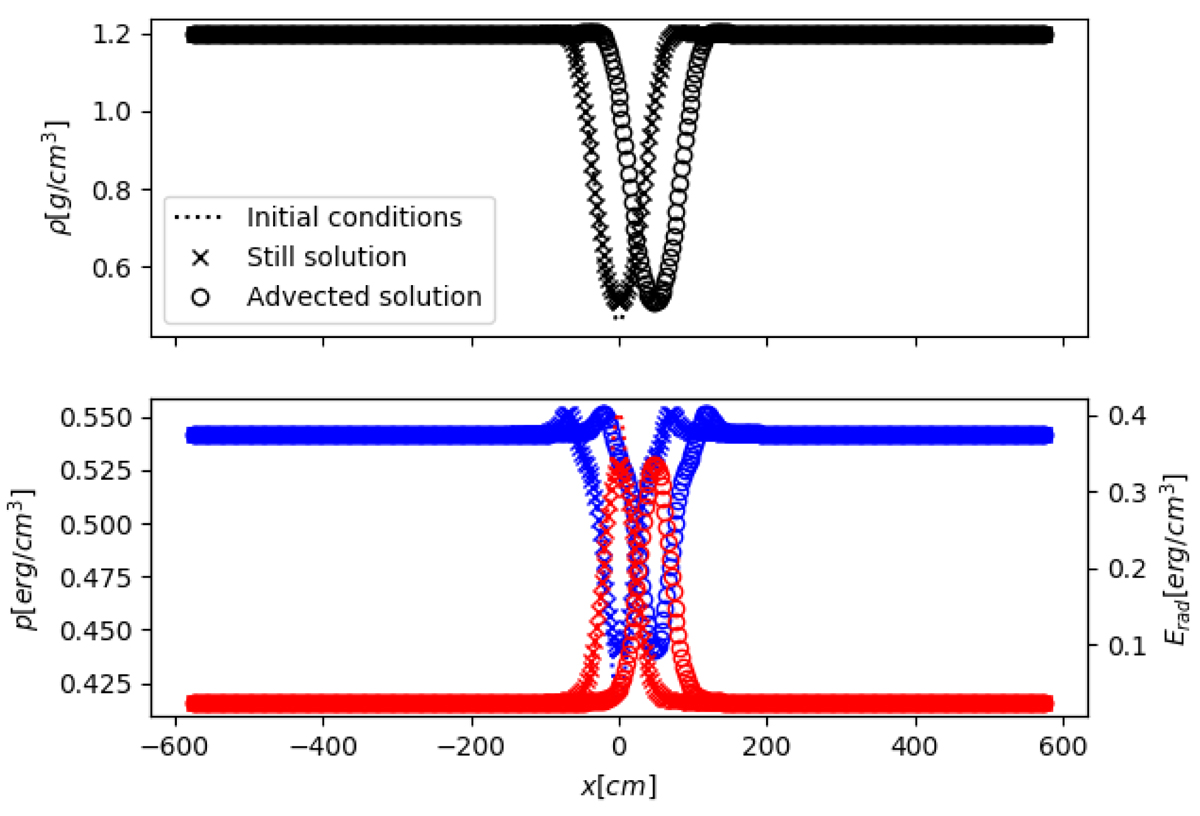
Fig. 3.
Download original image
Comparison of still and advected solutions in the Galilean invariance test. Top panel: density profiles with initial conditions (in dashed lines) are relaxed once with (marked with ‘o’) and once without (marked with ‘x’) an initial background velocity field. Bottom panel: same details but for the gas pressure (blue) and radiation energy density (red). The horizontal shift between the curves correspond to the expected rightward displacement.
Current usage metrics show cumulative count of Article Views (full-text article views including HTML views, PDF and ePub downloads, according to the available data) and Abstracts Views on Vision4Press platform.
Data correspond to usage on the plateform after 2015. The current usage metrics is available 48-96 hours after online publication and is updated daily on week days.
Initial download of the metrics may take a while.