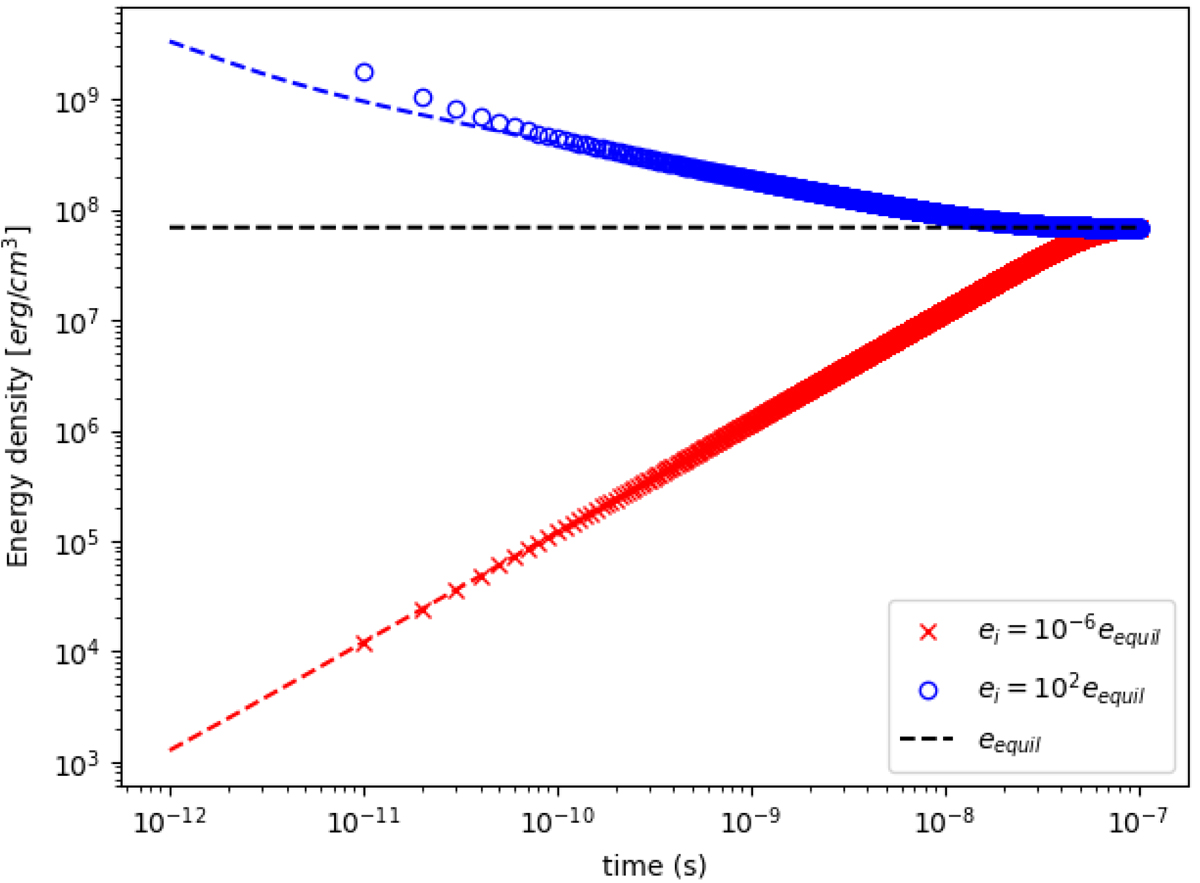
Fig. 1.
Download original image
Gas energy densities, as a function of time, of a gas that is relaxing to radiative equilibrium from two sets of initial conditions. Marked with a blue “o” is the relaxation where the initial gas energy is set as 102 times the expected equilibrium value. Marked with a red “x” is the initial gas energy is set as 10−6 times the equilibrium value. The dashed blue and red lines represent the same heating-cooling problem, but solved with a smaller numerical time step (see text). Since the time axis is logarithmic, the initial conditions at t = 0 are not visible.
Current usage metrics show cumulative count of Article Views (full-text article views including HTML views, PDF and ePub downloads, according to the available data) and Abstracts Views on Vision4Press platform.
Data correspond to usage on the plateform after 2015. The current usage metrics is available 48-96 hours after online publication and is updated daily on week days.
Initial download of the metrics may take a while.