Fig. 9.
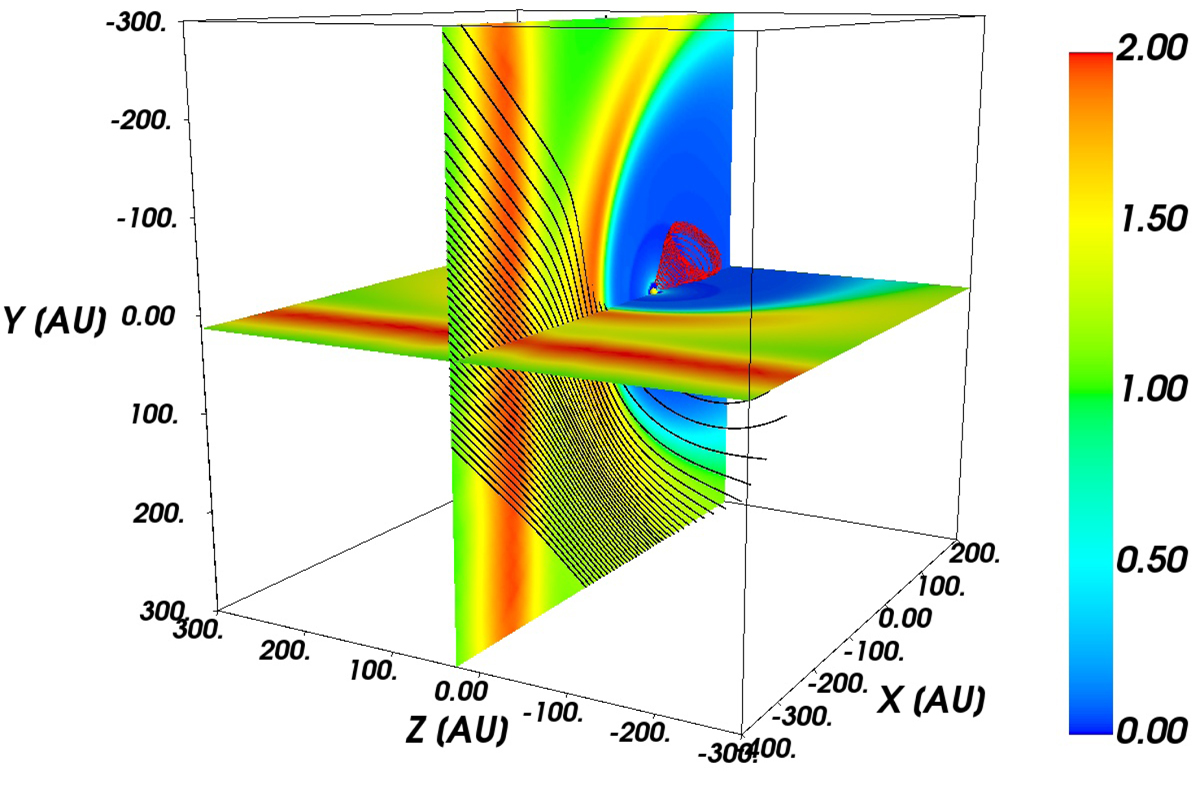
Download original image
Visualization of the initial condition in a time-dependent simulation of the interaction of a LISM fluctuation with the heliosphere. The plasma density np/np∞ distribution is shown in color. The LISM inflow is along x-axis. Black lines show some magnetic field lines starting in the B − V plane. Some of the magnetic field lines are draped onto the HP. Red planar structure in front of the simulated heliosphere is the LISM density perturbation. Close to the Sun located at (0,0,0), an internal heliospheric magnetic field line is shown (red line) in the form of a conical spiral.
Current usage metrics show cumulative count of Article Views (full-text article views including HTML views, PDF and ePub downloads, according to the available data) and Abstracts Views on Vision4Press platform.
Data correspond to usage on the plateform after 2015. The current usage metrics is available 48-96 hours after online publication and is updated daily on week days.
Initial download of the metrics may take a while.