Fig. 5.
Download original image
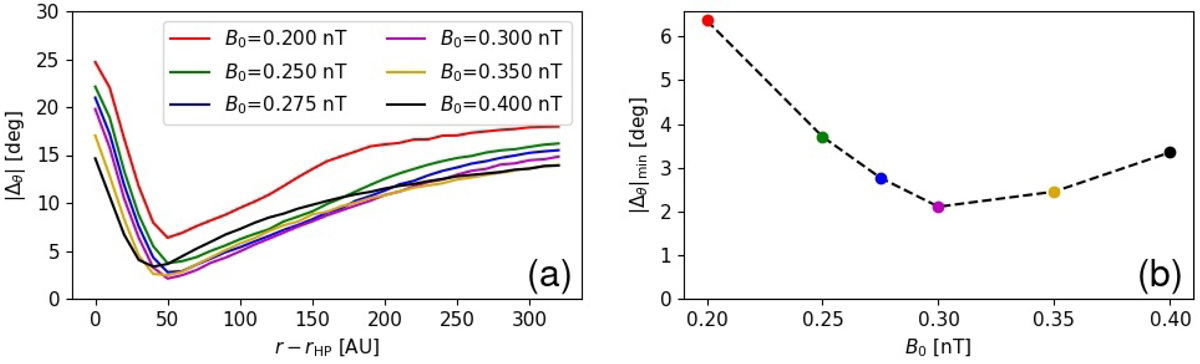
Dependence on the distance from the HP (HP1 definition) of the average angular distance |Δθ| between the simulated perpendicularity condition and the observed IBEX ribbon for different LISM magnetic field strengths, shown in panel a. Panel b: how the minimum of each profile in panel a depends on the LISM magnetic field strength. Colors of circles in panel b correspond to colors of lines in panel a. The minimum of the simulated dependence shown in panel b gives an estimate of the LISM magnetic field strength that provides the best fit to IBEX ribbon observations.
Current usage metrics show cumulative count of Article Views (full-text article views including HTML views, PDF and ePub downloads, according to the available data) and Abstracts Views on Vision4Press platform.
Data correspond to usage on the plateform after 2015. The current usage metrics is available 48-96 hours after online publication and is updated daily on week days.
Initial download of the metrics may take a while.