Fig. 4.
Download original image
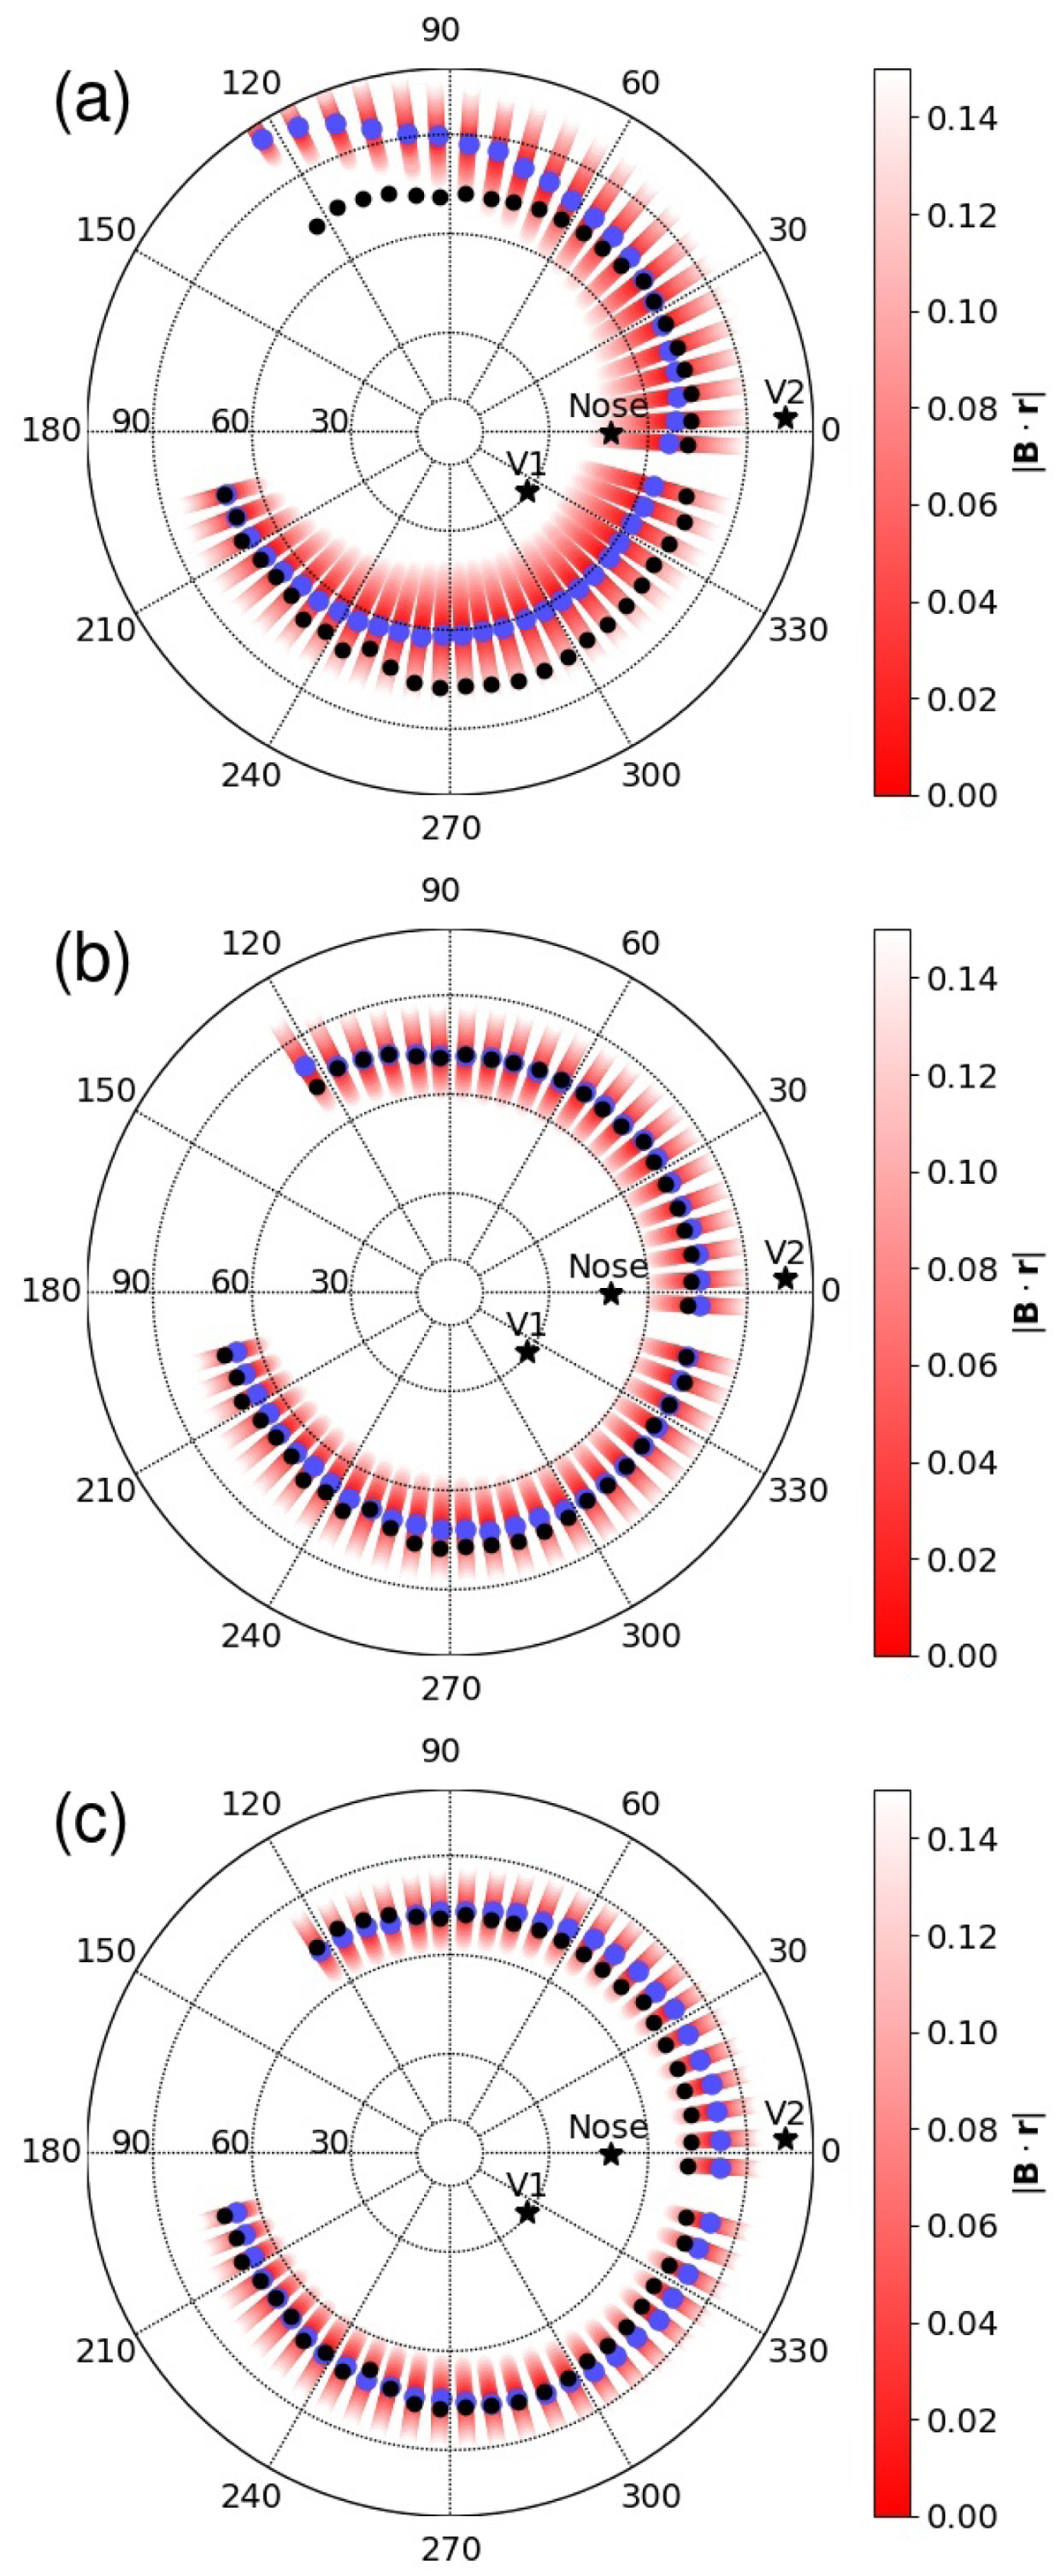
Distributions of the simulated perpendicularity condition in the IBEX-ribbon-center frame. Black circles show the position of the observed IBEX ribbon, shades of red color-coded values of the simulated distribution of ![]() (see the colorbar; only
(see the colorbar; only ![]() are visible due to the definition of the colorscale), and blue circles show the minimum of the simulated distribution. Different panels correspond to different distances from the HP (HP1 definition): (a) 20, (b) 50, and (c) 80 AU for the simulation case B∞ = 0.3 nT. The LISM inflow (heliospheric nose) direction is marked as Nose, positions of the Voyager 1 and 2 at the time of the HP crossing are denoted as V1 and V2.
are visible due to the definition of the colorscale), and blue circles show the minimum of the simulated distribution. Different panels correspond to different distances from the HP (HP1 definition): (a) 20, (b) 50, and (c) 80 AU for the simulation case B∞ = 0.3 nT. The LISM inflow (heliospheric nose) direction is marked as Nose, positions of the Voyager 1 and 2 at the time of the HP crossing are denoted as V1 and V2.
Current usage metrics show cumulative count of Article Views (full-text article views including HTML views, PDF and ePub downloads, according to the available data) and Abstracts Views on Vision4Press platform.
Data correspond to usage on the plateform after 2015. The current usage metrics is available 48-96 hours after online publication and is updated daily on week days.
Initial download of the metrics may take a while.