Fig. 16.
Download original image
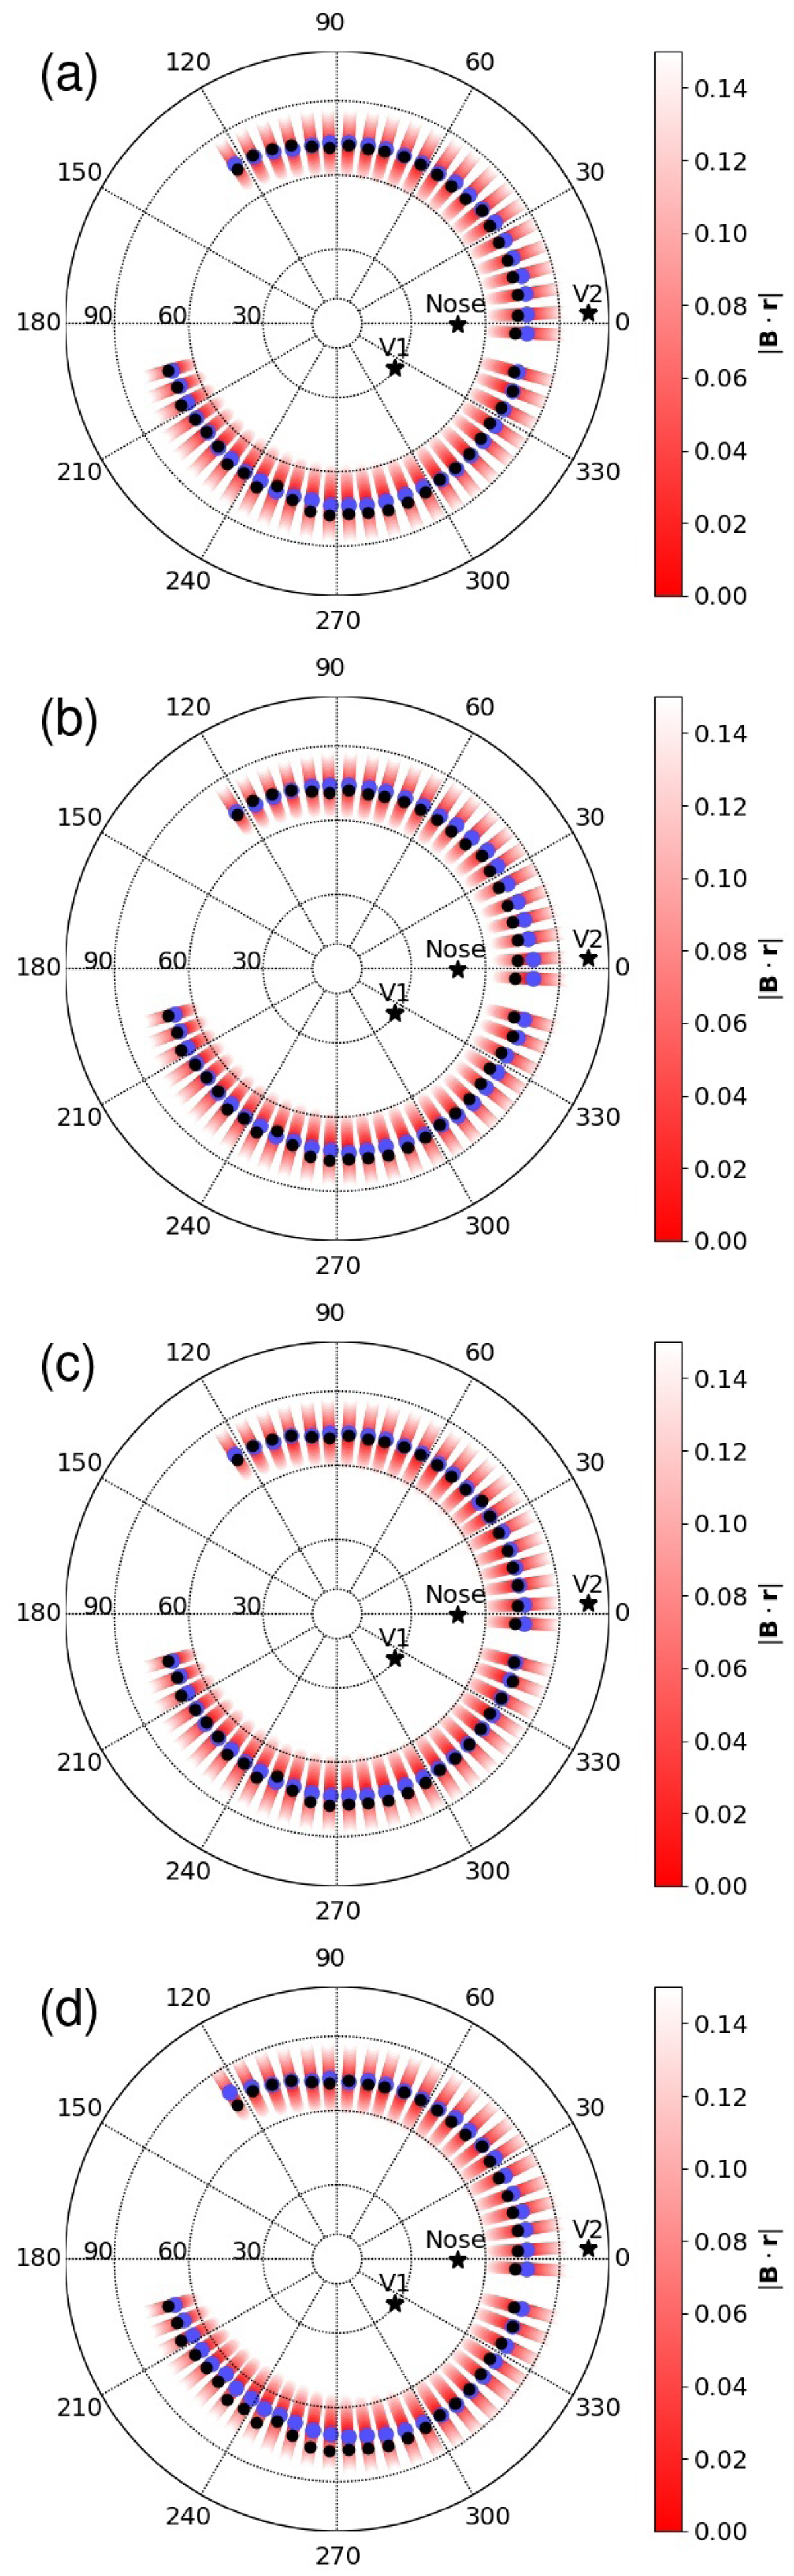
Distributions of the simulated perpendicularity condition in the IBEX-ribbon-center frame for characteristic phases of time-dependent simulations. Black circles show the position of the observed IBEX ribbon, shades of red – color coded values of the simulated distribution of ![]() (see the colorbar, only
(see the colorbar, only ![]() are visible due to our definition of the colorscale), and blue circles – the minimum of the simulated distribution. The simulated distribution of
are visible due to our definition of the colorscale), and blue circles – the minimum of the simulated distribution. The simulated distribution of ![]() in the sky is computed at a constant radial distance of 50 AU from the HP (HP2 definition), as inferred from Fig. 6. The initial condition in shown in panel a. Panel b: distribution of the perpendicularity condition for the solar cycle simulation at the time 15.2 years, corresponding to the first maximum of the blue curve in Fig. 15. Panel c: corresponds to the LISM-fluctuation simulations at the time 29.2 years, i.e., to the minimum of the orange curve in Fig. 15. Panel d: simulated distribution of the perpendicularity condition for the maximum of the orange curve in Fig. 15 that occurs at the simulation time 78.7 years.
in the sky is computed at a constant radial distance of 50 AU from the HP (HP2 definition), as inferred from Fig. 6. The initial condition in shown in panel a. Panel b: distribution of the perpendicularity condition for the solar cycle simulation at the time 15.2 years, corresponding to the first maximum of the blue curve in Fig. 15. Panel c: corresponds to the LISM-fluctuation simulations at the time 29.2 years, i.e., to the minimum of the orange curve in Fig. 15. Panel d: simulated distribution of the perpendicularity condition for the maximum of the orange curve in Fig. 15 that occurs at the simulation time 78.7 years.
Current usage metrics show cumulative count of Article Views (full-text article views including HTML views, PDF and ePub downloads, according to the available data) and Abstracts Views on Vision4Press platform.
Data correspond to usage on the plateform after 2015. The current usage metrics is available 48-96 hours after online publication and is updated daily on week days.
Initial download of the metrics may take a while.