Fig. 15.
Download original image
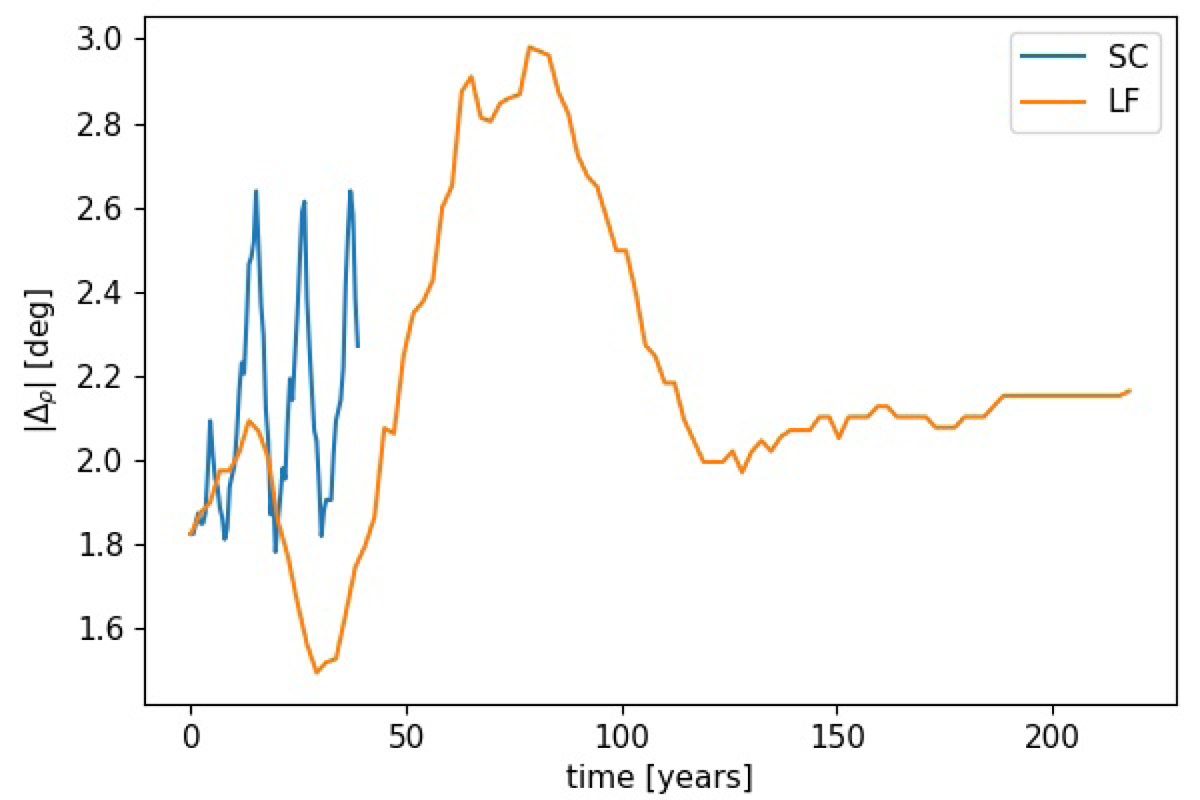
Time dependence of the average angular distance |Δθ| between the simulated perpendicularity condition and the observed IBEX ribbon. The results are shown for the solar-cycle (SC – blue line) and the LISM-fluctuation (LF – orange line) effects. The average angular distance |Δθ| is computed using the locations of the simulated condition ![]() in the sky computed at a constant radial distance of 50 AU from the HP (HP2 definition is used here), as inferred from Fig. 6.
in the sky computed at a constant radial distance of 50 AU from the HP (HP2 definition is used here), as inferred from Fig. 6.
Current usage metrics show cumulative count of Article Views (full-text article views including HTML views, PDF and ePub downloads, according to the available data) and Abstracts Views on Vision4Press platform.
Data correspond to usage on the plateform after 2015. The current usage metrics is available 48-96 hours after online publication and is updated daily on week days.
Initial download of the metrics may take a while.