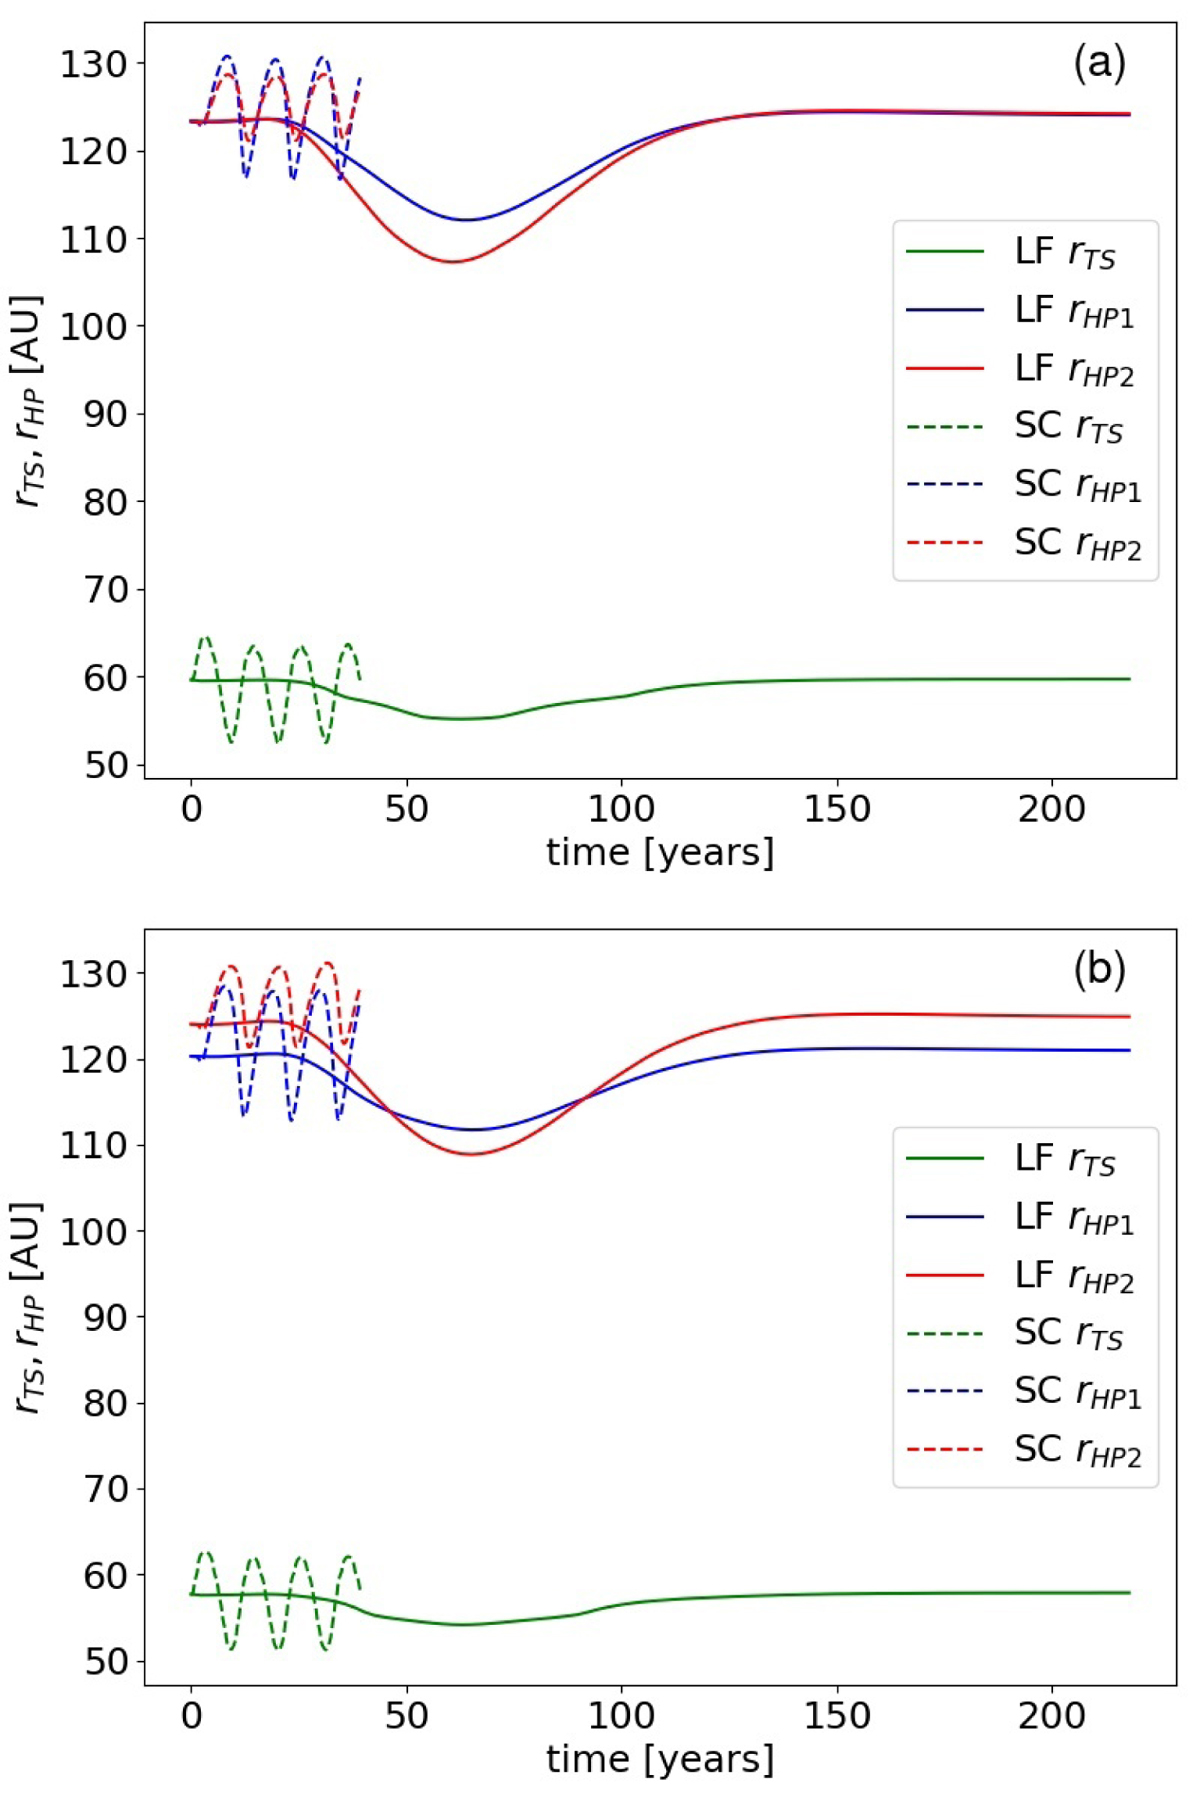
Fig. 13.
Download original image
Time dependence of the distance from the Sun to the TS and HP under the influence of the solar-cycle (SC – dashed line) and the LISM-fluctuation (LF – solid line) effects. Panel a: results for Voyager 1 and panel b – for Voyager 2. Green color shows results for the TS, and red/blue color – for the HP. Two HP definitions are used to test the generality of the simulation results.
Current usage metrics show cumulative count of Article Views (full-text article views including HTML views, PDF and ePub downloads, according to the available data) and Abstracts Views on Vision4Press platform.
Data correspond to usage on the plateform after 2015. The current usage metrics is available 48-96 hours after online publication and is updated daily on week days.
Initial download of the metrics may take a while.