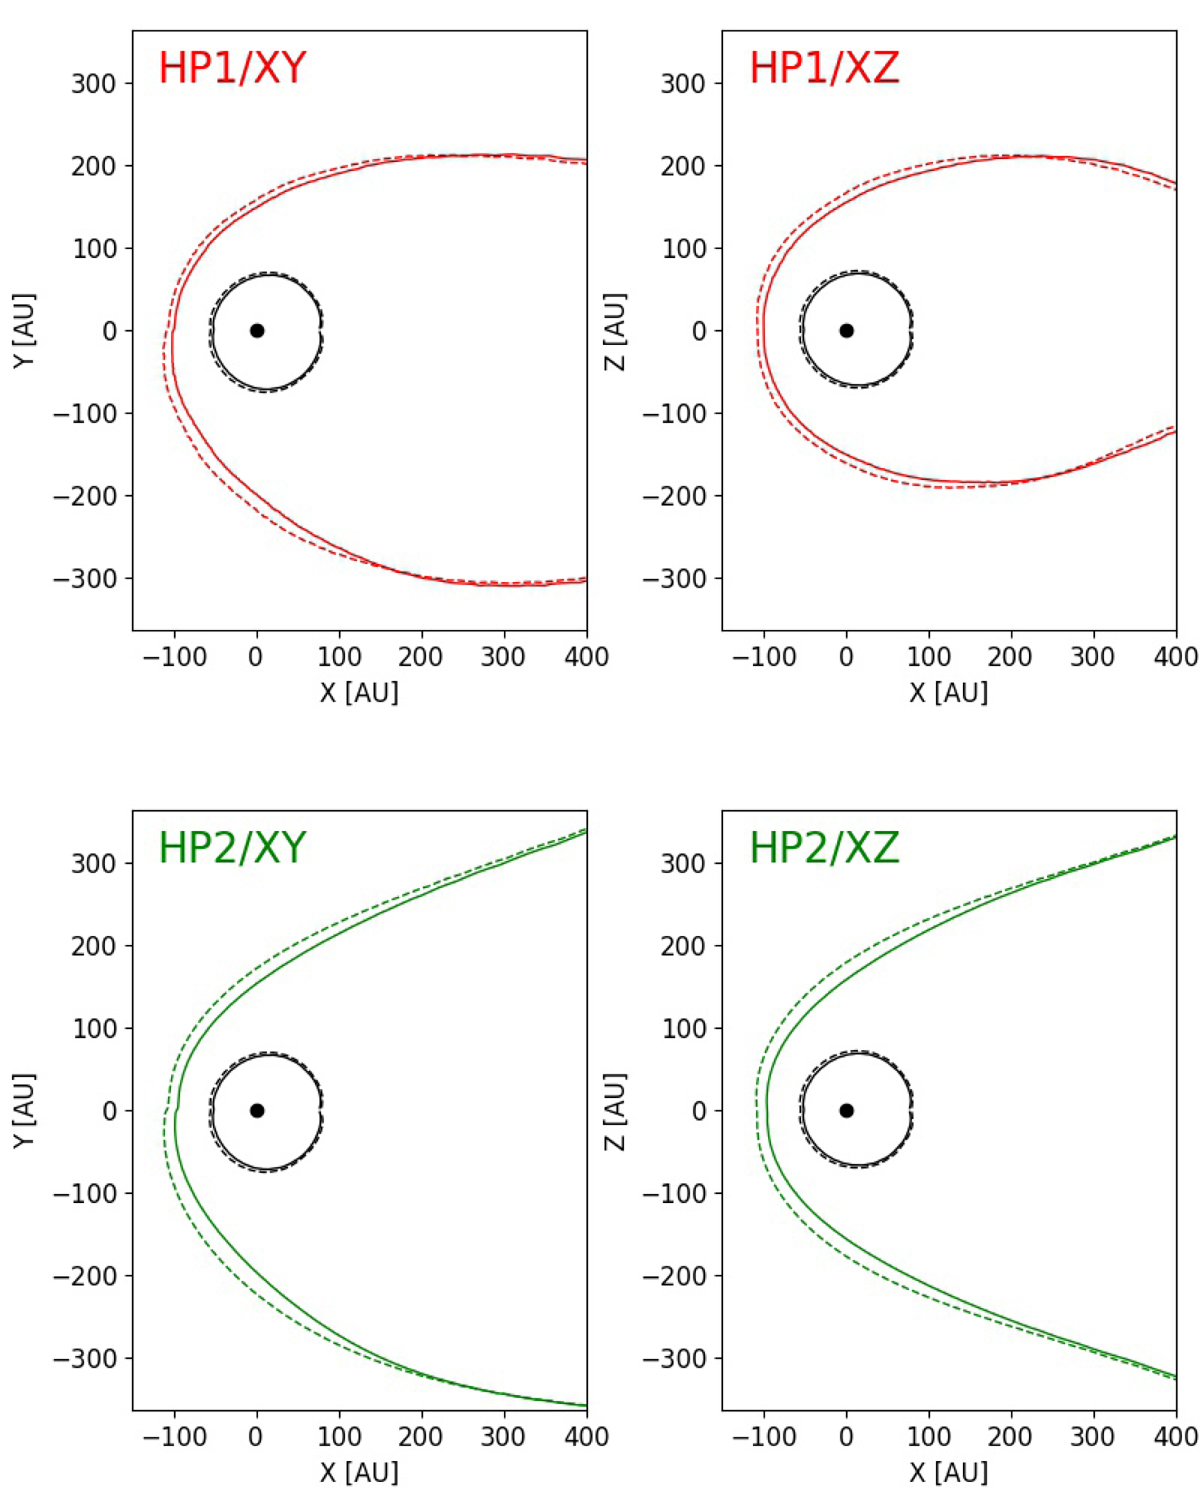
Fig. 11.
Download original image
Comparison of the TS, HP1 (upper panels, red color) and HP2 (lower panels, green color) positions for the initial condition (dashed line) and the LISM-fluctuation simulation time corresponding to 65.17 years (solid line). Both the B − V plane cut (HP1/XY and HP2/XY, the left column) and a perpendicular plane cut (HP1/XZ and HP2/XZ, the right column) through the three-dimensional solution are shown.
Current usage metrics show cumulative count of Article Views (full-text article views including HTML views, PDF and ePub downloads, according to the available data) and Abstracts Views on Vision4Press platform.
Data correspond to usage on the plateform after 2015. The current usage metrics is available 48-96 hours after online publication and is updated daily on week days.
Initial download of the metrics may take a while.