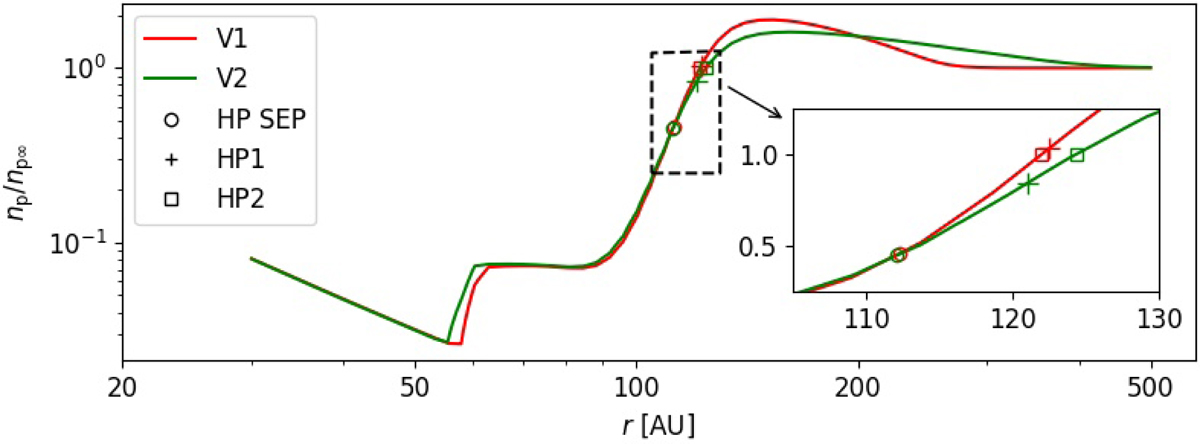
Fig. 1.
Download original image
Simulated density profile along Voyager 1 and 2 trajectories for the case where B∞ = 0.3 nT. Locations of three HP definitions are shown in the plot: HP1 (based on the maximum slope of the density profile), HP2 (isocontour np = np∞) and separatrix-based definition HP SEP. The inset shows in detail the region embraced by dashed lines in the main plot. The main plot uses the logarithmic vertical scale, while in the inset, the vertical scale is linear.
Current usage metrics show cumulative count of Article Views (full-text article views including HTML views, PDF and ePub downloads, according to the available data) and Abstracts Views on Vision4Press platform.
Data correspond to usage on the plateform after 2015. The current usage metrics is available 48-96 hours after online publication and is updated daily on week days.
Initial download of the metrics may take a while.