Fig. 5.
Download original image
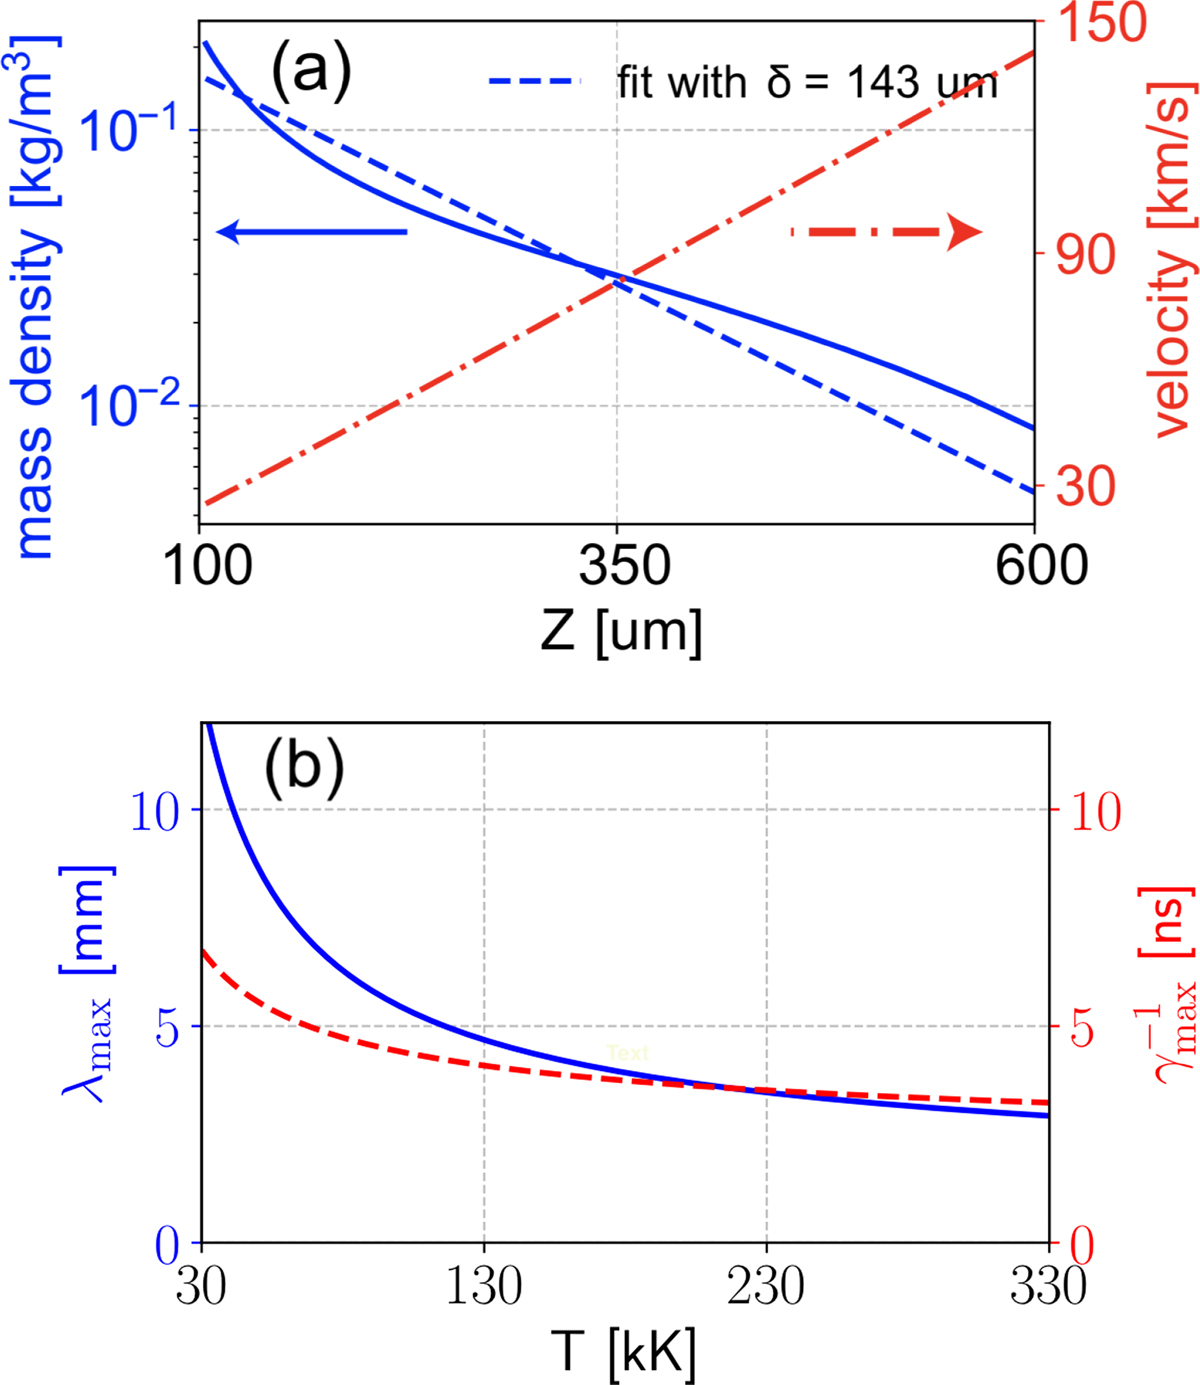
(a) Plasma mass density (solid blue) and velocity (dash-dotted red) distribution along the z axis from the ESTHER simulation at 5 ns. The dashed blue line shows the best fit of the mass density lineout. (b) Temperature dependence of the fastest growing mode wavelength (solid blue) and the growth time (dashed red) for the RT instability, using the parameters from the ESTHER simulation at 5 ns around z = 350 μm for Eq. (11).
Current usage metrics show cumulative count of Article Views (full-text article views including HTML views, PDF and ePub downloads, according to the available data) and Abstracts Views on Vision4Press platform.
Data correspond to usage on the plateform after 2015. The current usage metrics is available 48-96 hours after online publication and is updated daily on week days.
Initial download of the metrics may take a while.