Open Access
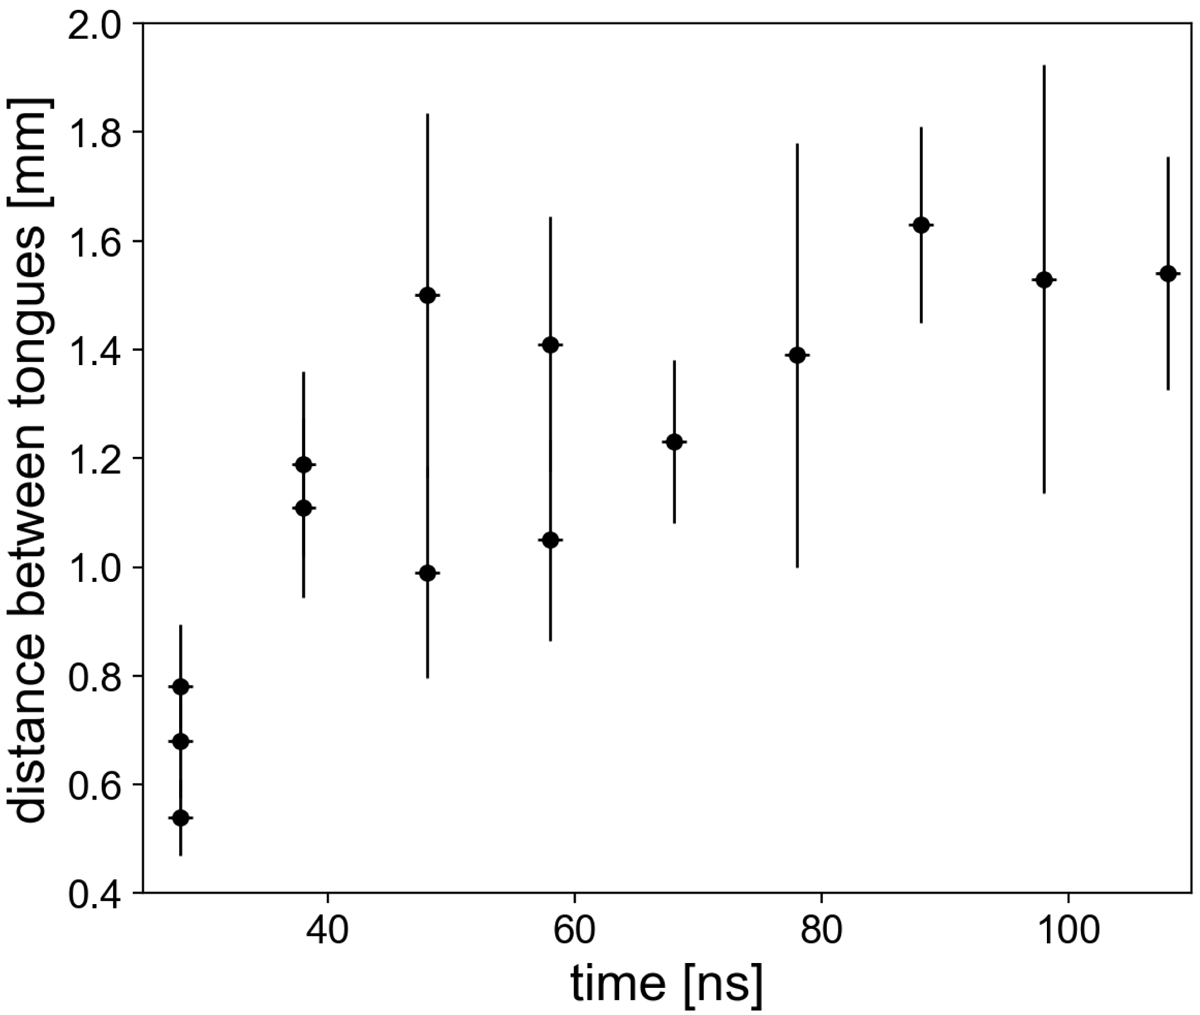
Fig. 3.
Download original image
Growth of the averaged distance between tongues, as inferred from the optical diagnostic of the expanding plasma, such as that shown in Fig. 2. Black points are the averaged distance values, and the black lines are the error bars. Each black dot on the graph corresponds to a unique shot.
Current usage metrics show cumulative count of Article Views (full-text article views including HTML views, PDF and ePub downloads, according to the available data) and Abstracts Views on Vision4Press platform.
Data correspond to usage on the plateform after 2015. The current usage metrics is available 48-96 hours after online publication and is updated daily on week days.
Initial download of the metrics may take a while.