Fig. 2.
Download original image
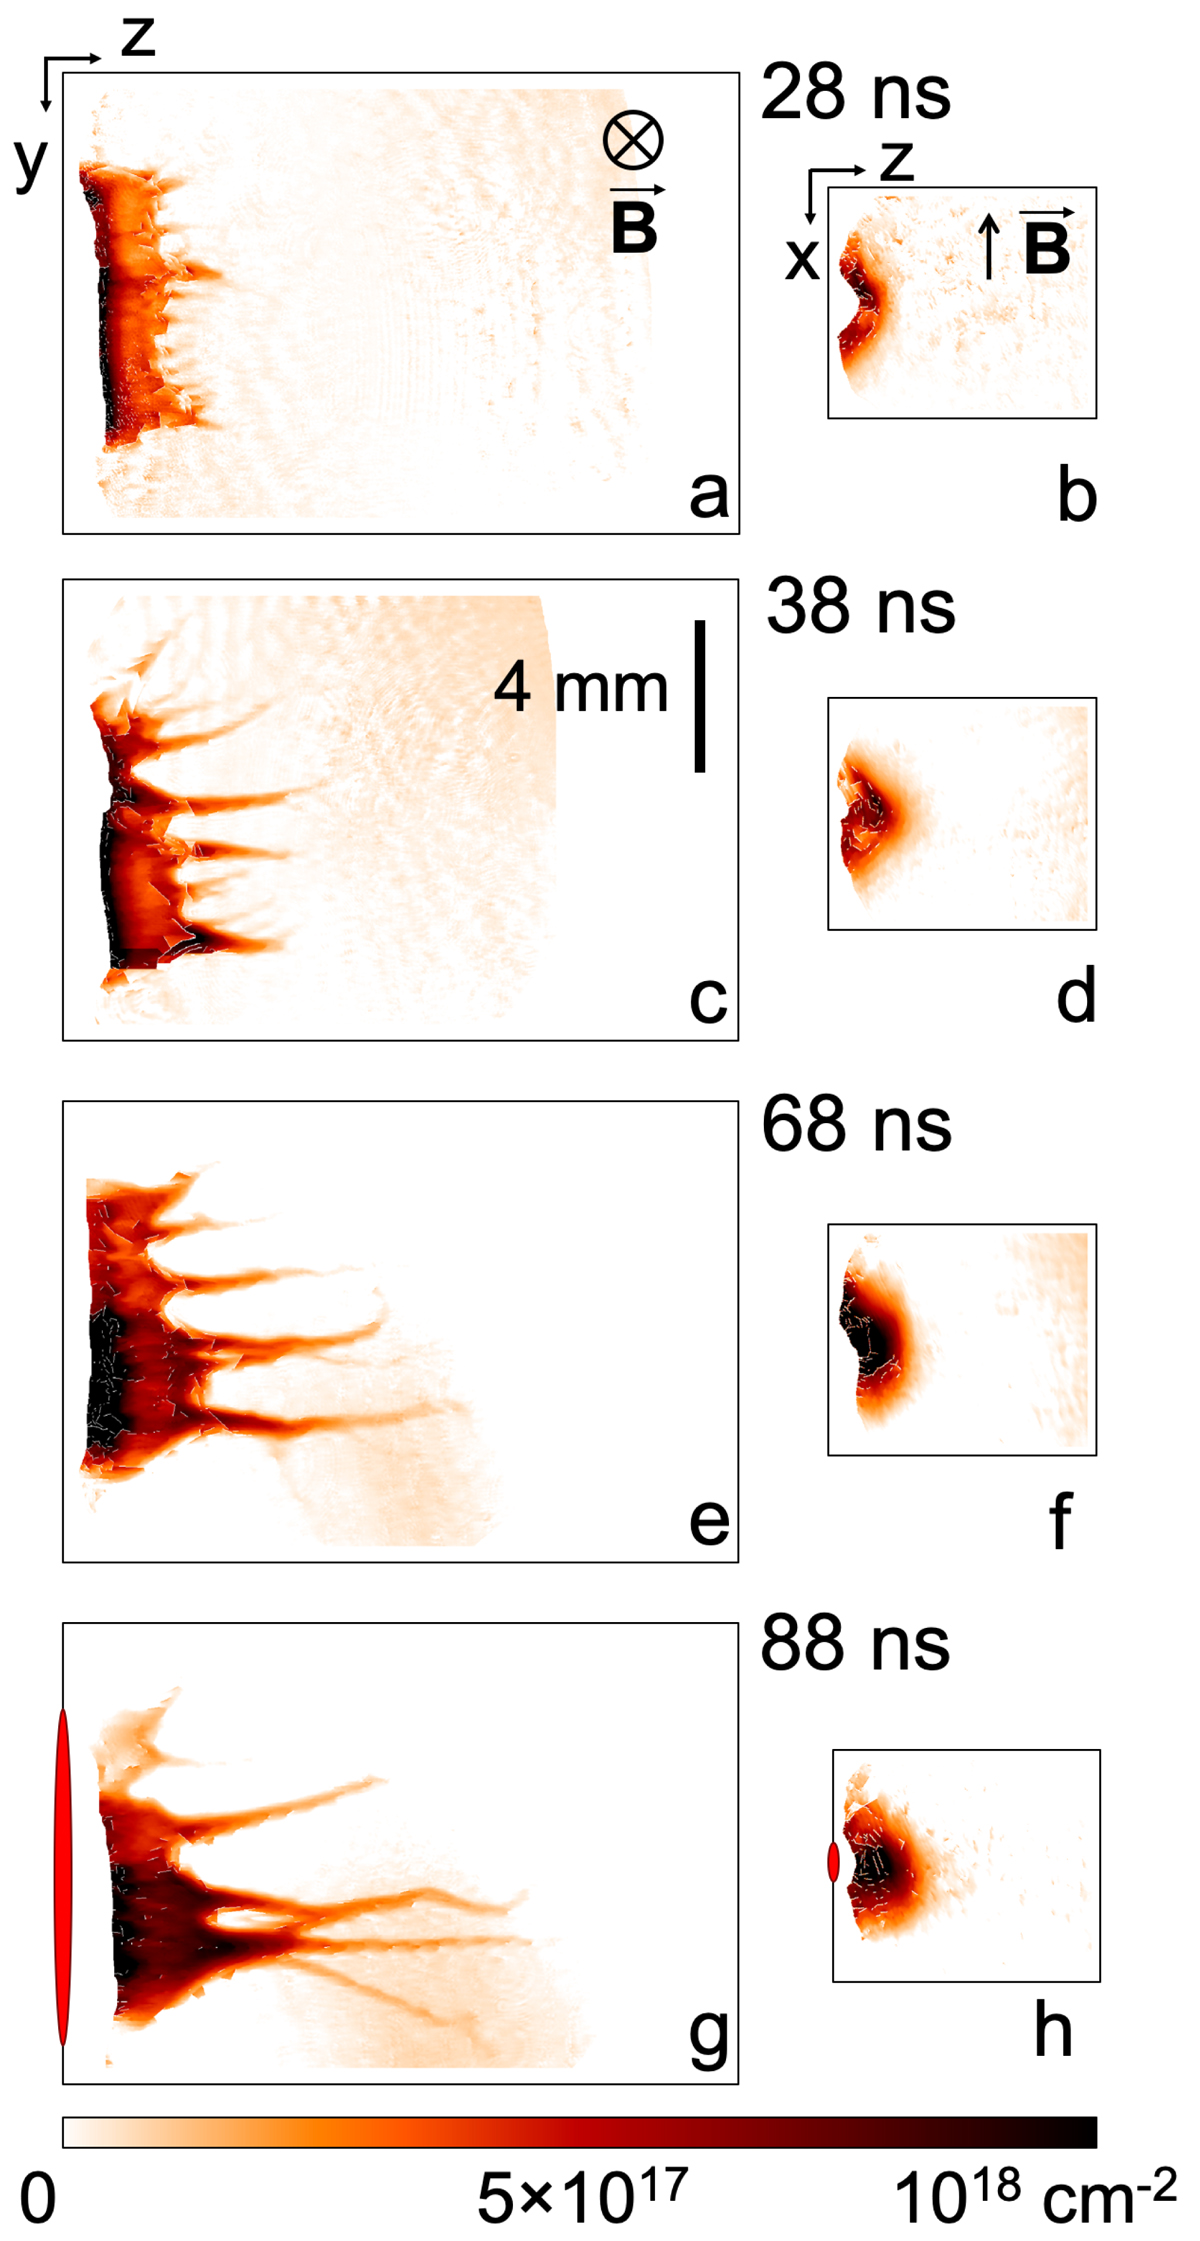
Two-dimensional density profiles of the propagating plasma stream in the yz plane (a, c, e, and g) and the xz plane (b, d, f, and h) at 28 ns (a and b), 38 ns (c and d), 68 ns (e and f), 88 ns (g and h) after the laser irradiation of the target. The spatial scale, shown in (c), is the same for all the images. The colour bar is the same for all the images. The red ellipses on the left edge of the box in panels (g) and (h) represent the characteristic sizes in the yz and xz planes respectively, of the laser beam irradiating the target.
Current usage metrics show cumulative count of Article Views (full-text article views including HTML views, PDF and ePub downloads, according to the available data) and Abstracts Views on Vision4Press platform.
Data correspond to usage on the plateform after 2015. The current usage metrics is available 48-96 hours after online publication and is updated daily on week days.
Initial download of the metrics may take a while.