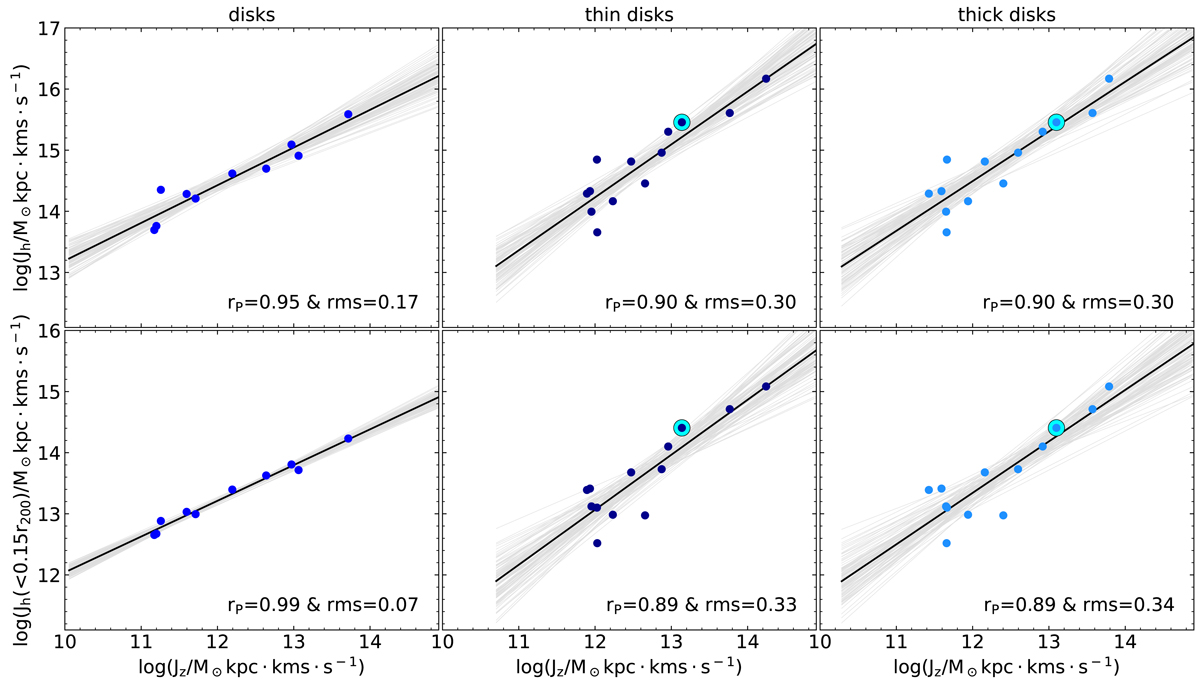
Fig. 1.
Download original image
Relations between the azimuthal AM of the dynamical disk components and the AM modulus of the DM halo for the galaxy sample in Paper II. Top panels: y-axis gives the total DM AM within the virial radius Jh, while the bottom ones show the AM within 15% of the virial radius Jh(< 0.15 r200). From left to right, the panels show the relations for (single large scale) disks, thin and thick, respectively. In each panel, the black line is the linear fit through the data points, while the gray lines show 100 realization of the relation drawn from the covariance matrix of the fit. The Pearson correlation coefficient rP and the root-mean-square deviation rms are given in the bottom right corner of each panel. In the top and central panels, the highlighted cyan points correspond to the best MW analog in the NIHAO sample, g8.26e11 (Obreja et al. 2018; Buck et al. 2020).
Current usage metrics show cumulative count of Article Views (full-text article views including HTML views, PDF and ePub downloads, according to the available data) and Abstracts Views on Vision4Press platform.
Data correspond to usage on the plateform after 2015. The current usage metrics is available 48-96 hours after online publication and is updated daily on week days.
Initial download of the metrics may take a while.