Fig. 9
Download original image
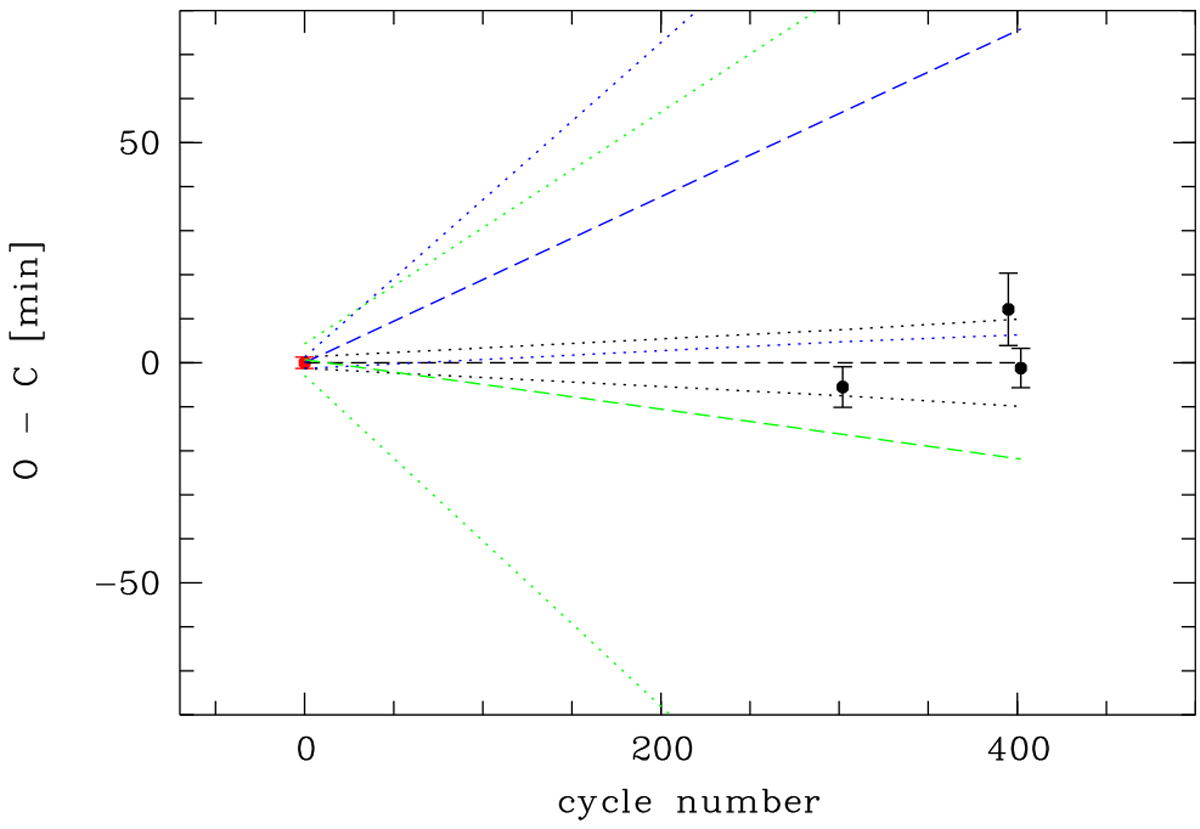
Observed minus calculated mid-transit times for K2-138c. The measurements of this work are plotted in black and the literature value of T0 of Lopez et al. (2019) in red. The literature ephemerides of Christiansen et al. (2018) and Lopez et al. (2019) are presented in green and blue, respectively. The dashed line presents the timing prediction, and the dotted lines present the 1 σ uncertainty ranges.
Current usage metrics show cumulative count of Article Views (full-text article views including HTML views, PDF and ePub downloads, according to the available data) and Abstracts Views on Vision4Press platform.
Data correspond to usage on the plateform after 2015. The current usage metrics is available 48-96 hours after online publication and is updated daily on week days.
Initial download of the metrics may take a while.