Fig. 5
Download original image
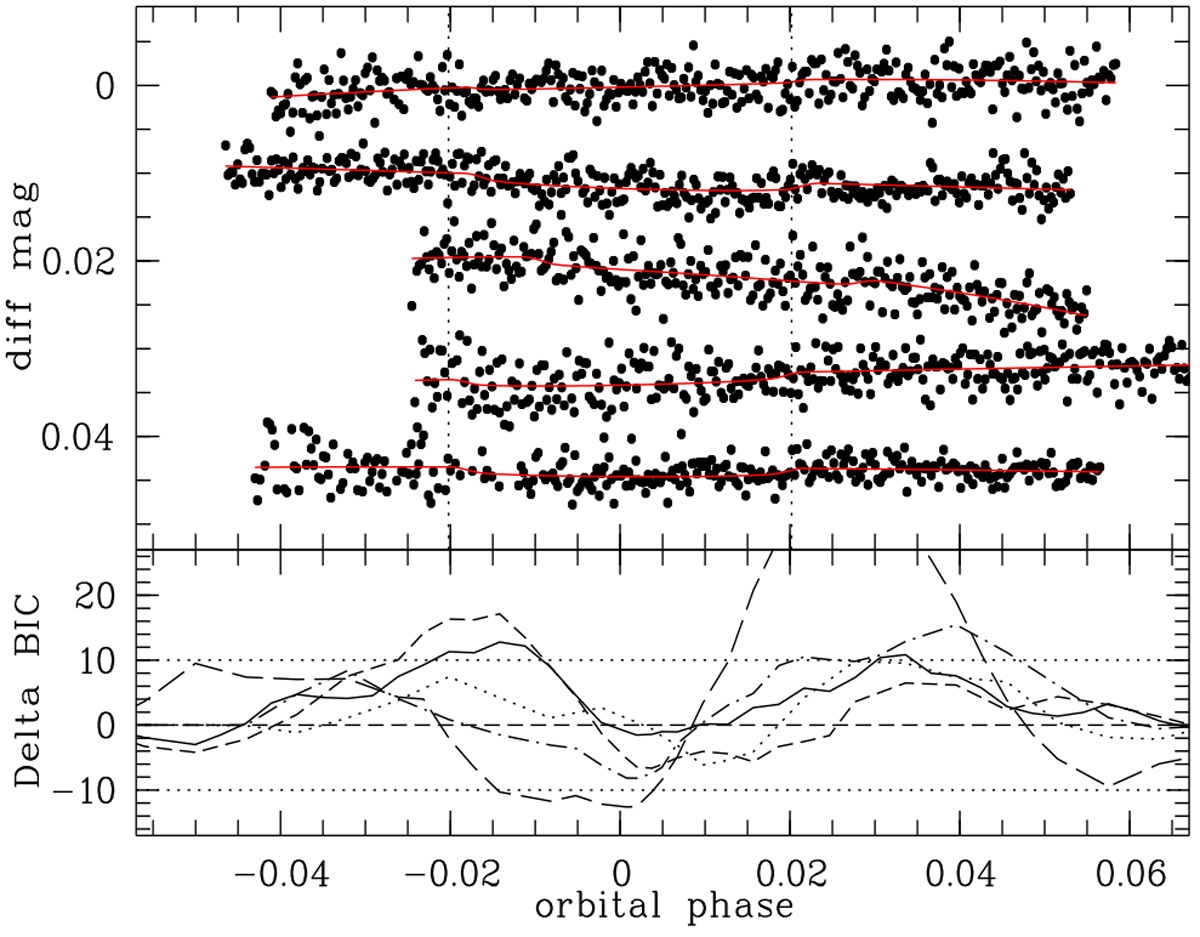
STELLA photometry of K2-100b. The orbital phase is calculated according to the ephemeris of Barragán et al. (2019). The best-fit models with k and T0 as free parameter are overplotted as solid red lines. The predicted times of first and forth contact are marked with vertical dotted lines. Lower panel: difference in the BIC of the best-fit model including the transit, in which the shape is fixed to the Barragán et al. (2019) transit parameters, and a model without the transit (detrending-only), when the transit is shifted along the x-axis. Values for light curves 1, 2, 3, 4, and 5 are given as solid, dashed, dotted, dashed-dotted, and long-dashed lines. The fifth light curve presents a significant detection crossing the Δ BIC threshold,while the second to forth light curves present tentative detections with minimum Δ BIC lower than −5.
Current usage metrics show cumulative count of Article Views (full-text article views including HTML views, PDF and ePub downloads, according to the available data) and Abstracts Views on Vision4Press platform.
Data correspond to usage on the plateform after 2015. The current usage metrics is available 48-96 hours after online publication and is updated daily on week days.
Initial download of the metrics may take a while.