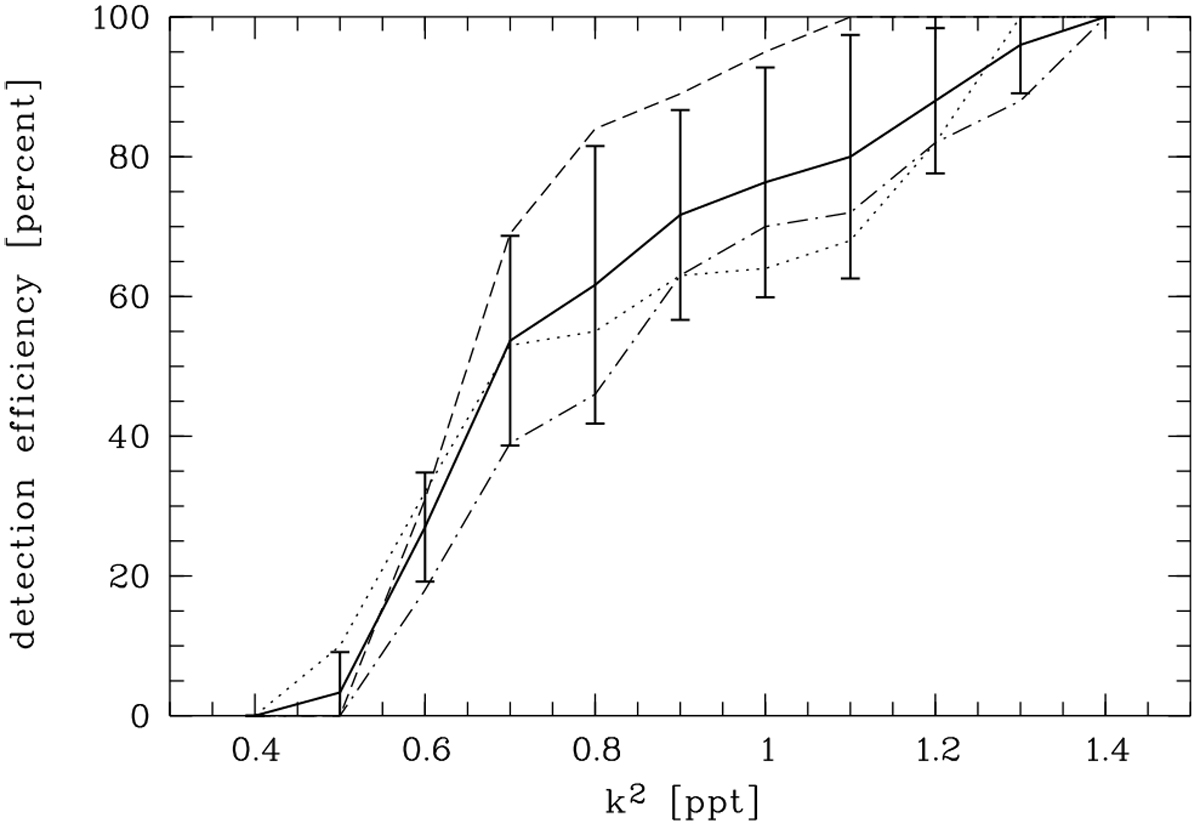
Fig. 11
Download original image
Transit signal detection efficiency for three selected individual data sets. We injected transit signals of various depths into the data and tested whether they were recovered significantly using the detection criterion of Δ BIC < −10. The detection efficiency for the individual light curves of November 18, 2019, June 22, 2020, and March 9, 2020, are shown with a dotted, dashed, and dash-dotted line, respectively. Their mean with standard deviation is shown as the thick solid line. Nearly 100% detection efficiency is reached for signal depths of 1.3 ppt.
Current usage metrics show cumulative count of Article Views (full-text article views including HTML views, PDF and ePub downloads, according to the available data) and Abstracts Views on Vision4Press platform.
Data correspond to usage on the plateform after 2015. The current usage metrics is available 48-96 hours after online publication and is updated daily on week days.
Initial download of the metrics may take a while.