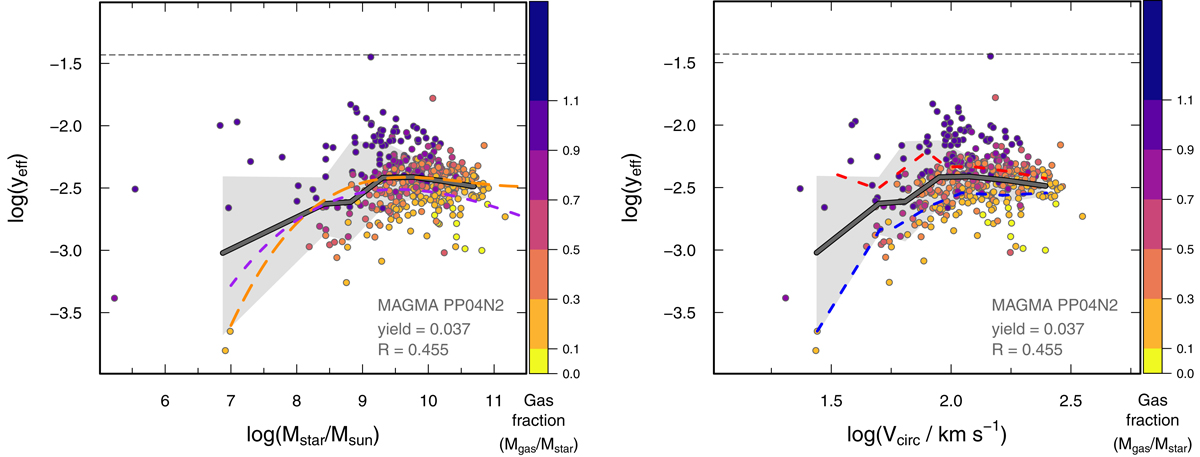
Fig. 8.
Download original image
Effective yield as a function of Mstar (left panel) and Vcirc (right panel). Galaxies are coded by gas fraction, Fg, as shown in the vertical color bar. MAGMA medians are shown as a heavy gray line, with ±1σ excursions as the surrounding gray regions. Also shown in the left panel as two dashed curves are the predictions from the Δη and ζw parameterizations (see also Fig. 3), with the symmetric Δη priors given as a short-dashed (purple) curve, and the Δη ≥ 0 priors as a long-dashed (orange) one. The right panel illustrates galaxies with high star-formation efficiency (short gas depletion times) with a blue dashed curve, and those with low efficiency (long depletion times) as a red one. The horizontal short-dashed line corresponds to the yield of 0.037 adopted in this paper. See text for more details.
Current usage metrics show cumulative count of Article Views (full-text article views including HTML views, PDF and ePub downloads, according to the available data) and Abstracts Views on Vision4Press platform.
Data correspond to usage on the plateform after 2015. The current usage metrics is available 48-96 hours after online publication and is updated daily on week days.
Initial download of the metrics may take a while.