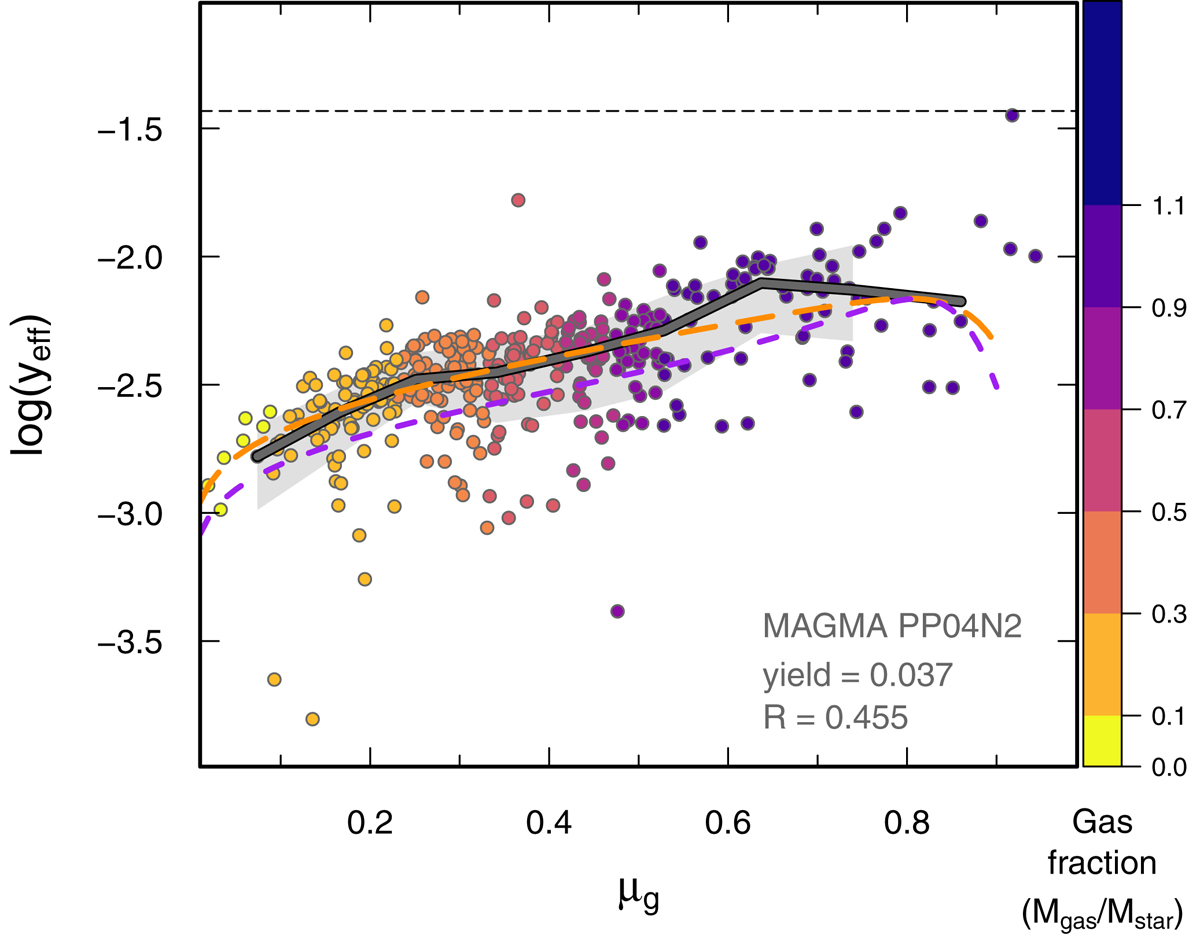
Fig. 7.
Download original image
Effective yield as a function of μg. Galaxies are coded by gas fraction, Fg, as shown in the vertical color bar. MAGMA medians are shown as a heavy gray line, with ±1σ excursions as the surrounding gray regions. The two dashed curves correspond to the predictions from the Δη and ζw parameterizations (see also Fig. 3), with the symmetric Δη priors given as a short-dashed (purple) curve, and the Δη ≥ 0 priors as a long-dashed (orange) one. The horizontal dashed line corresponds to our adopted true yield y = 0.037 (see text).
Current usage metrics show cumulative count of Article Views (full-text article views including HTML views, PDF and ePub downloads, according to the available data) and Abstracts Views on Vision4Press platform.
Data correspond to usage on the plateform after 2015. The current usage metrics is available 48-96 hours after online publication and is updated daily on week days.
Initial download of the metrics may take a while.