Fig. 6.
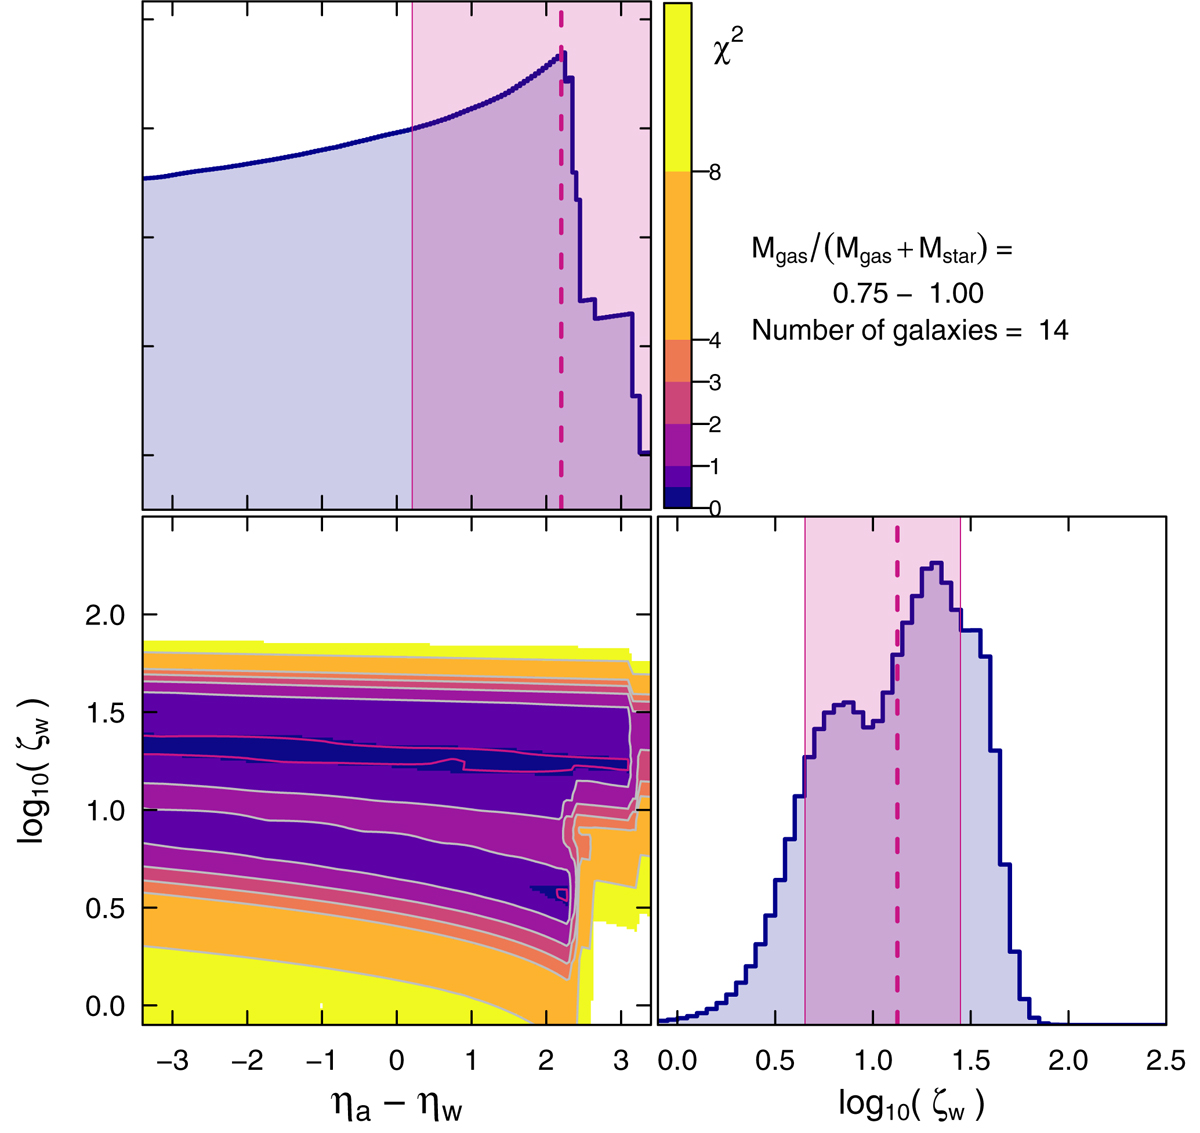
Download original image
Corner plot of χ2 surface as a function of the model parameters (Δη, ζw) for the highest μg bin MAGMA, here with a higher boundary than in Fig. 5: μg > 0.75. As in previous figures, the violet contours correspond to the minimum χ2 value, and the top and right panels report the probability density distributions for the marginalized parameters. Confidence intervals (±1σ) are shown as violet-tinted shaded rectangular regions, and the MLE (PDF mode for Δη, median for ζw) is shown by a vertical dashed line.
Current usage metrics show cumulative count of Article Views (full-text article views including HTML views, PDF and ePub downloads, according to the available data) and Abstracts Views on Vision4Press platform.
Data correspond to usage on the plateform after 2015. The current usage metrics is available 48-96 hours after online publication and is updated daily on week days.
Initial download of the metrics may take a while.