Fig. 3.

Download original image
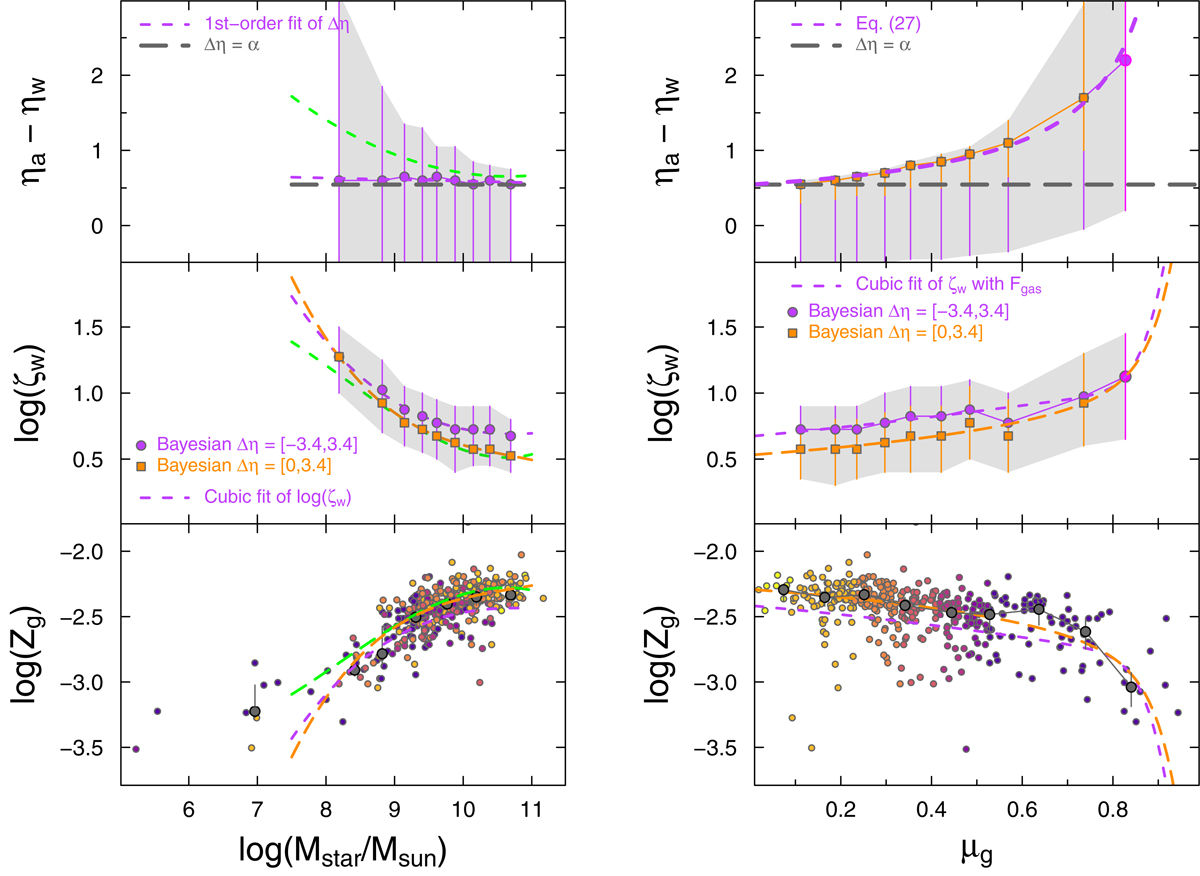
Difference of mass-loading factors Δη and metal-loading factors ζw inferred from the Bayesian analysis, and observed Zg in the bottom panel, as a function of Mstar on the left, and as a function of μg on the right. In the two upper panels, the best-fit Bayesian values are shown as filled symbols (circles or squares according to the Δη prior), with error bars corresponding to the ±1σ excursion, which is also illustrated by light-gray shaded regions. The rightmost point (magenta circle) in the top and middle right panels corresponds to the “extra” high-μg bin shown in Fig. 6. In the top panels, a horizontal dashed line illustrates the “equilibrium solution” with Δη = α. In the top left panel, the (purple) dashed curve is a linear power-law fit of Δη to log(Mstar), while the dashed curve in the top right panel shows Eq. (27), with d log Mg/d log Mstar = 0.72, as found in Paper II. The fits to the curves for ζw in the middle panels are cubic: log(ζw) as a function of log(Mstar) in the left panel, and ζw as a function of Fg in the right. In the lower panels, observed MAGMA Zg are shown as small filled circles, color coded by gas fraction, while the Zg medians and 1σ deviations are shown by large (black) filled circles and error bars. The dashed curves in the lower panels correspond to the calculation of Zg based on the fits in the upper panels (as a function of μg on the left, and log(Mstar) on the right): the long-dashed curves (dark orange) correspond to the Δη ≥ 0 priors, while the short-dashed ones (purple) to the “symmetric” priors. The green curves in the left panels are described in the text, obtained by fitting individual galaxy Δη and ζw calculated using Eqs. (27) and (28).
Current usage metrics show cumulative count of Article Views (full-text article views including HTML views, PDF and ePub downloads, according to the available data) and Abstracts Views on Vision4Press platform.
Data correspond to usage on the plateform after 2015. The current usage metrics is available 48-96 hours after online publication and is updated daily on week days.
Initial download of the metrics may take a while.


