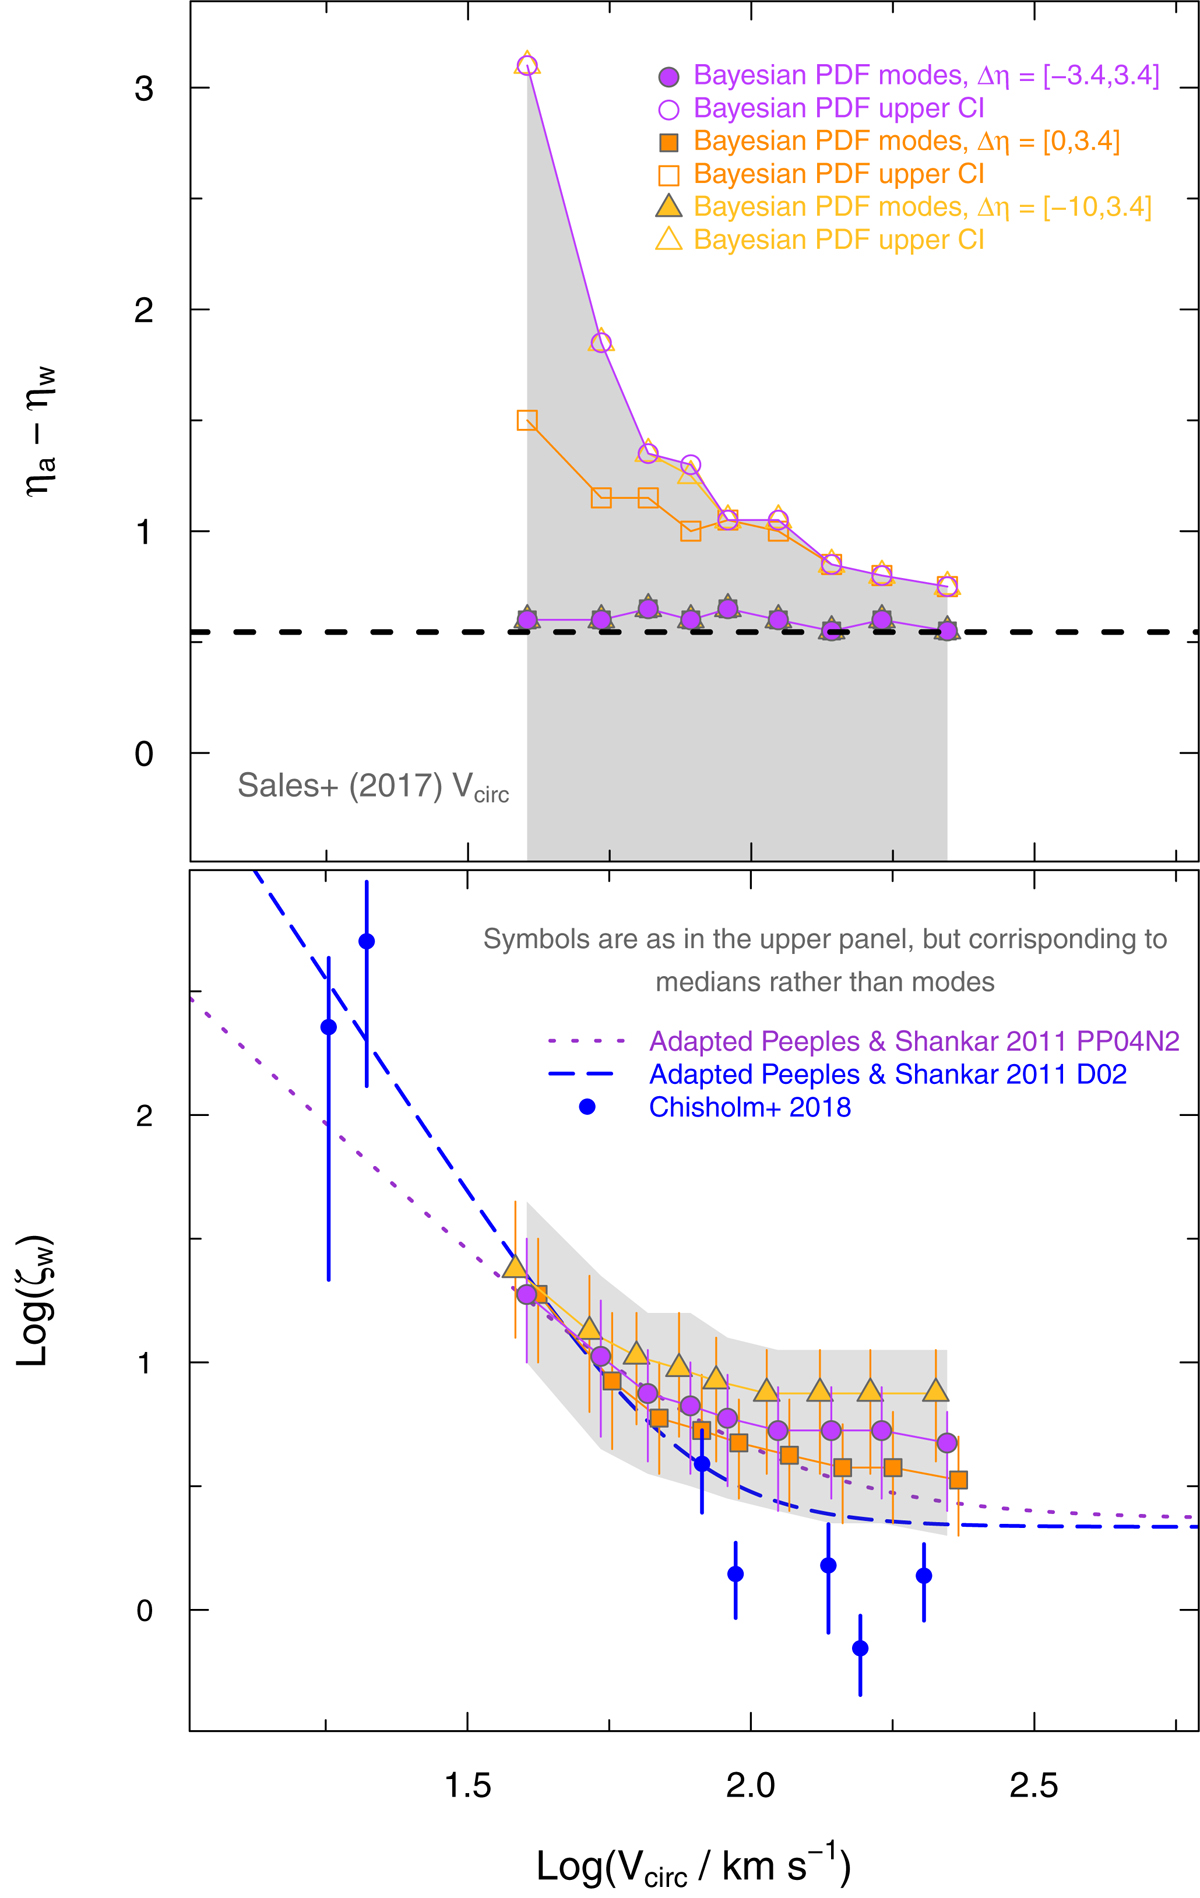
Fig. 2.
Download original image
Difference of mass-loading factors Δη (top panel) and metal-loading factors ζw (bottom panel) as a function of virial velocities obtained from the BTFR from Sales et al. (2017). In both panels, filled symbols show the Bayesian results, and in the top panel, open ones illustrate the upper bound of the PDF 1σ confidence intervals (CI). Different symbol types correspond to the interval of Δη in the Bayesian priors, as described in the text; the symbols for Δη ∈ [0, 3.4] and Δη ∈ [ − 10, 3.4] are (arbitrarily) offset along the abscissa for better visibility. The gray regions give the ±1σ uncertainties in the best-fit values. Also shown is the “equilibrium” asymptote, namely Δη = α (see Sect. 3.1). In the top panel, the two estimates of Δη from different priors are exactly coincident. In the bottom panel, the formulations by Peeples & Shankar (2011) for two O/H calibrations, redone here for our value of y, are given by (purple) short-dashed and (blue) long-dashed curves for the PP04N2 and D02 calibrations, respectively. Also shown are the metal-loading factors computed by Chisholm et al. (2018) from COS data. The text gives more details.
Current usage metrics show cumulative count of Article Views (full-text article views including HTML views, PDF and ePub downloads, according to the available data) and Abstracts Views on Vision4Press platform.
Data correspond to usage on the plateform after 2015. The current usage metrics is available 48-96 hours after online publication and is updated daily on week days.
Initial download of the metrics may take a while.