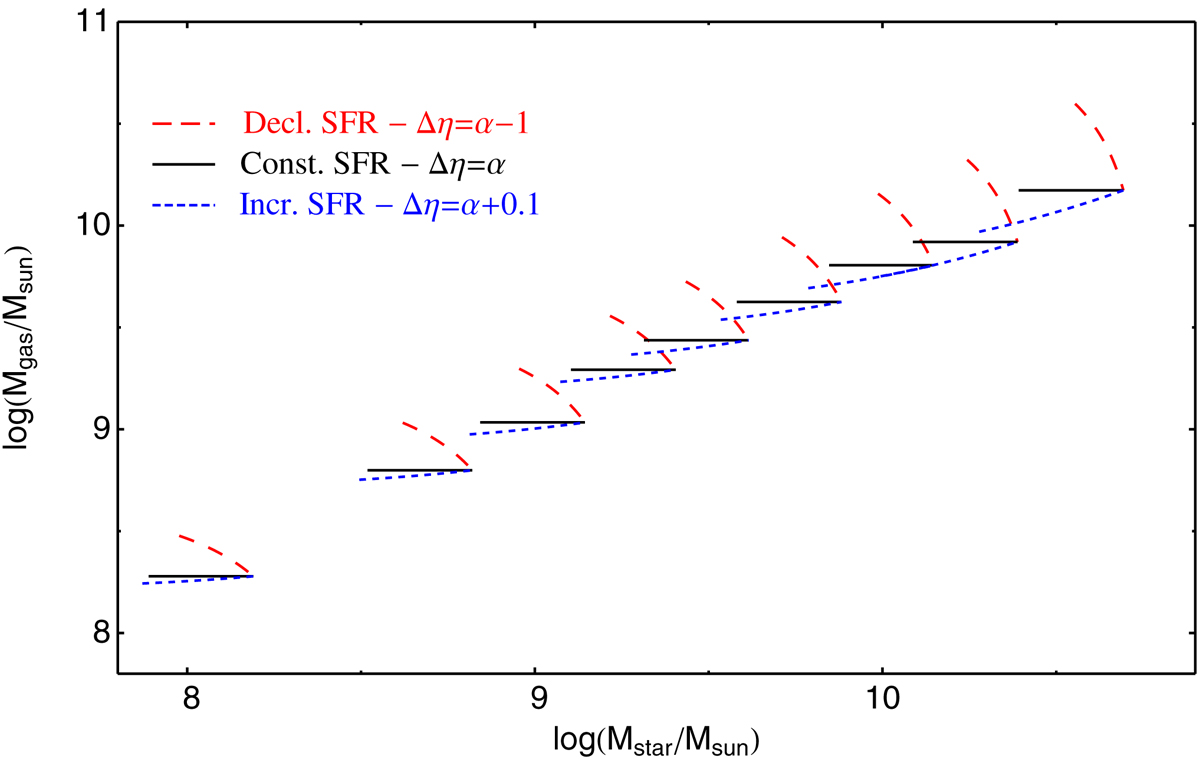
Fig. B.2.
Download original image
Time evolution of Mg vs Mstar over the last 50% of the galaxies’ lifetime, according to the toy-model based on three exponential SFHs: β = ( − 1, 0, 1), and also assuming that the SFR timescale τSF is the same as the gas depletion time, τg = ![]() . Galaxy age tgal is given by Eq. (B.4), ψ0 by Eq. (B.3), and the Mg evolution by Eq. (14). The median curves in different Mstar bins are plotted, where the (median observed) gas mass Mg is taken to be Mg(tgal). For Δη = α, the equilibrium solution, Mg = Mi throughout the lifetime of the galaxy.
. Galaxy age tgal is given by Eq. (B.4), ψ0 by Eq. (B.3), and the Mg evolution by Eq. (14). The median curves in different Mstar bins are plotted, where the (median observed) gas mass Mg is taken to be Mg(tgal). For Δη = α, the equilibrium solution, Mg = Mi throughout the lifetime of the galaxy.
Current usage metrics show cumulative count of Article Views (full-text article views including HTML views, PDF and ePub downloads, according to the available data) and Abstracts Views on Vision4Press platform.
Data correspond to usage on the plateform after 2015. The current usage metrics is available 48-96 hours after online publication and is updated daily on week days.
Initial download of the metrics may take a while.