Free Access
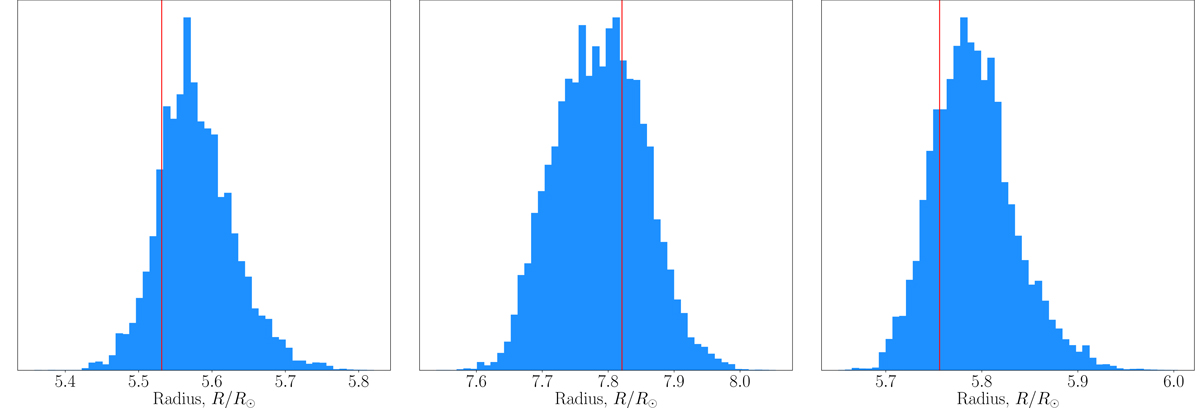
Fig. 5.
Download original image
Probability distribution functions for the radius of HD 64121 (left), HD 22532 (middle), and HD 69123 (right). The vertical red line in the plots indicates the position of the best model in the grid (without interpolation by AIMS).
Current usage metrics show cumulative count of Article Views (full-text article views including HTML views, PDF and ePub downloads, according to the available data) and Abstracts Views on Vision4Press platform.
Data correspond to usage on the plateform after 2015. The current usage metrics is available 48-96 hours after online publication and is updated daily on week days.
Initial download of the metrics may take a while.