Fig. 8
Download original image
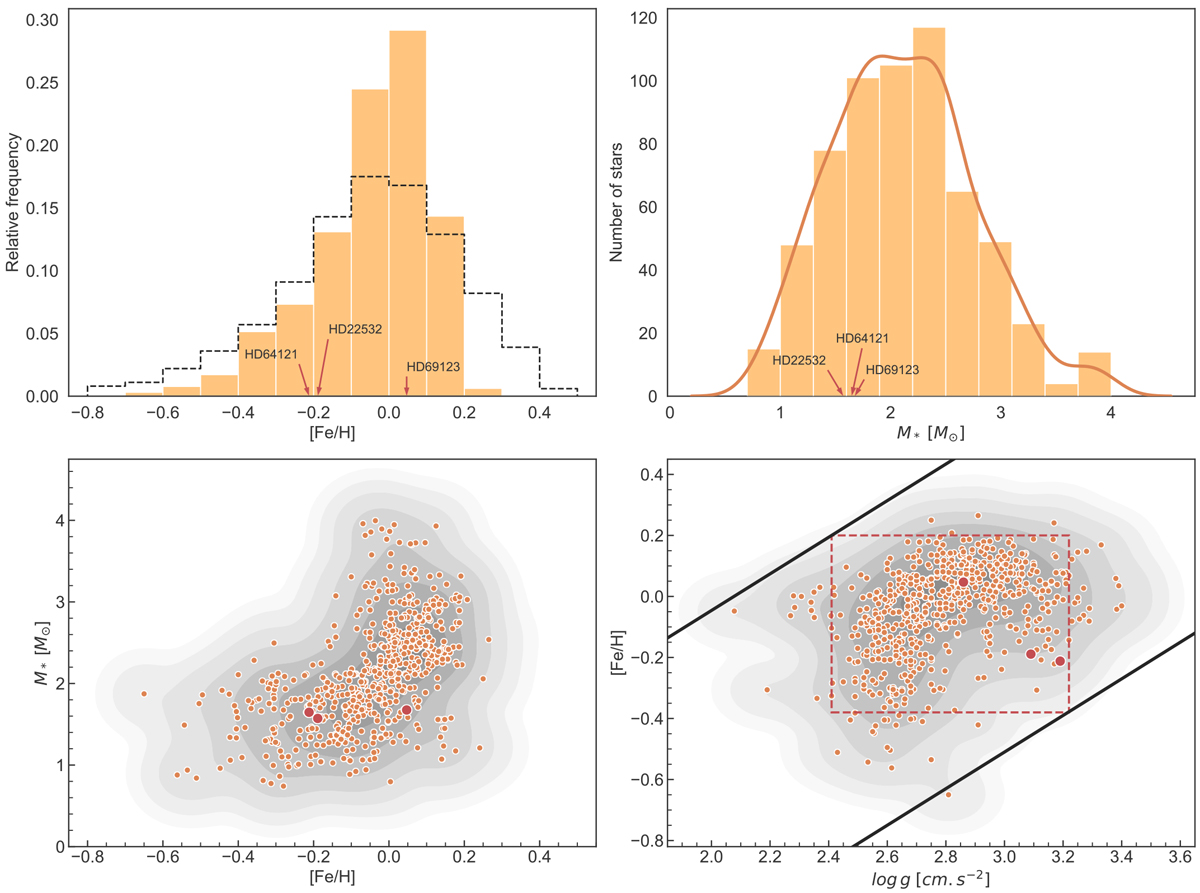
Distributions and relations between stellar parameters for our subsample of 620 stars. Top left: metallicity distribution of the stars of our sample (colored in orange) compared with the same distribution for the ~ 1000 stars (dashed histogram) in the CORALIE volume-limited sample (Udry et al. 2000; Santos et al. 2001). Top right: distribution of the stellar masses obtained from track fitting. The corresponding kernel density estimation is overplotted in orange, using a Gaussian kernel. Bottom left: mass vs. metallicity relation. (bottom right) Metallicity vs. logarithm of surface gravity. The two black lines were drawn by eye and show the biases in the samples due to the B − V cut-off. The red-dashed rectangle delimits the area of the potential unbiased subsample. The three planet hosts presented in this paper are represented by red dots.
Current usage metrics show cumulative count of Article Views (full-text article views including HTML views, PDF and ePub downloads, according to the available data) and Abstracts Views on Vision4Press platform.
Data correspond to usage on the plateform after 2015. The current usage metrics is available 48-96 hours after online publication and is updated daily on week days.
Initial download of the metrics may take a while.