Fig. 6
Download original image
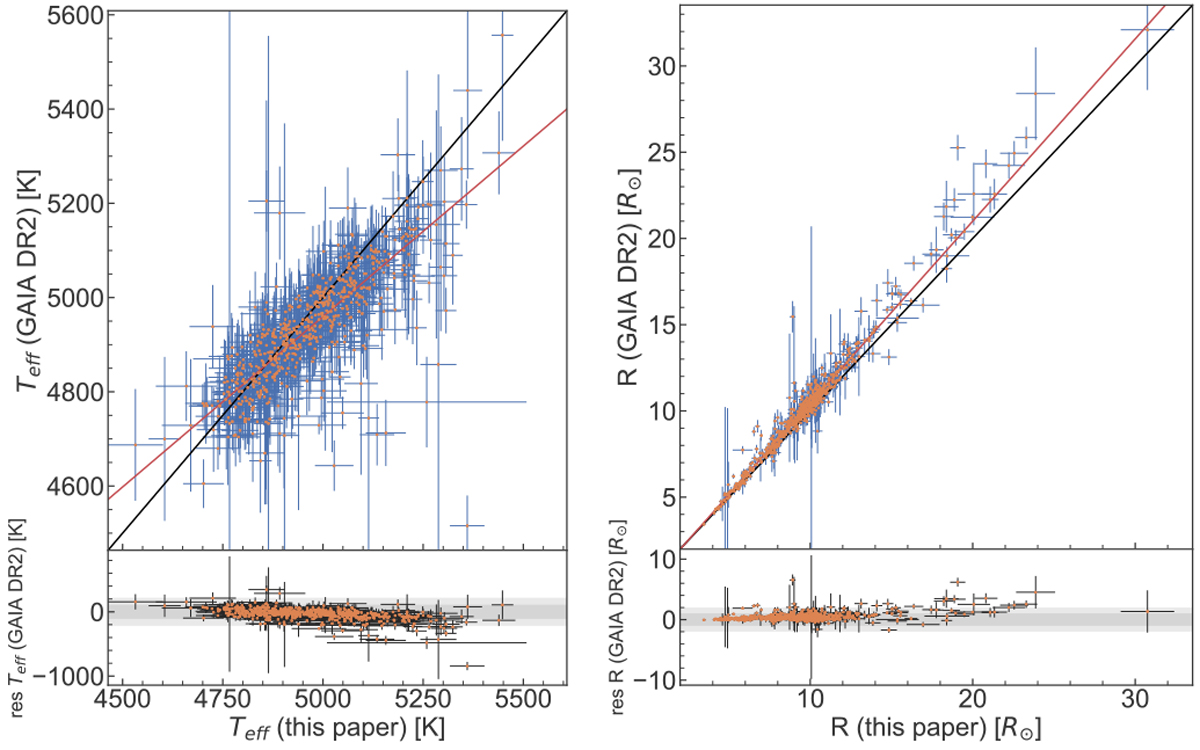
Comparison plots of photometric (from Brown et al. 2018) and spectroscopic (from this paper) determinations of the effective temperatures and the stellar radii. The black diagonal line represents the 1:1 correlation and the red line represents the linear fit of the data. At the bottom of each figure, the residuals compared to the 1:1 correlation are shown, with their 1 and 2σ dispersions represented by the shaded regions. Left: effective temperatures seem to show a linear trend, but this is not significant compared to the dispersion of the date of ~ 110 K, inside which more than 85% of the data is located. Right: radii are in good agreement but show an apparent trend and increasing dispersion for masses above than ~ 15 M⊙.
Current usage metrics show cumulative count of Article Views (full-text article views including HTML views, PDF and ePub downloads, according to the available data) and Abstracts Views on Vision4Press platform.
Data correspond to usage on the plateform after 2015. The current usage metrics is available 48-96 hours after online publication and is updated daily on week days.
Initial download of the metrics may take a while.