Fig. 5
Download original image
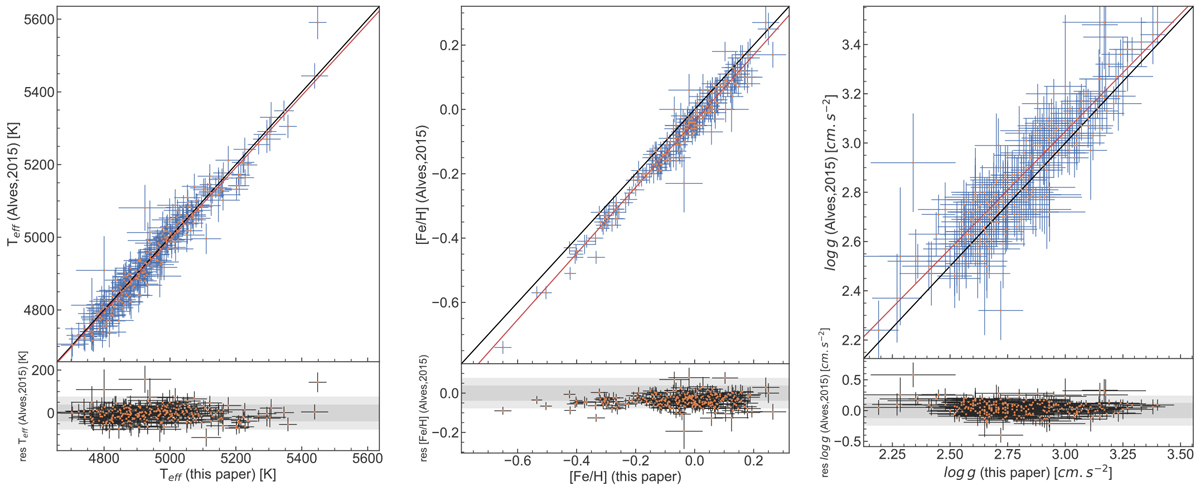
Comparison plots of spectroscopic parameters extracted from CORALIE (this paper) and UVES (Alves et al. 2015) spectra of the subsample of 254 stars in common. The black diagonal line represents the 1:1 correlation, and the red line represents the linear fit of the data. At the bottom of each figure, the residuals compared to the 1:1 correlation are shown, with their 1 and 2σ dispersions represented by the shaded regions. Left: effective temperatures seem to be perfectly correlated, with a dispersion of ~38 K. Middle: metallicity ratio of iron [Fe/H] shows an apparent positive offset of the order of the dispersion of the data around the 1:1 correlation, ~0.04 [dex] in favor of our estimation. More than 50% of the subsample is inside the 1σ region and 90% inside the 2σ. Right: logarithm of the surface gravity shows a good correlation, with an offset ~ 0.05 cms−2 lower than apparent dispersion of the data around the 1:1 correlation. More than 70% of the subsample is inside the 1σ region.
Current usage metrics show cumulative count of Article Views (full-text article views including HTML views, PDF and ePub downloads, according to the available data) and Abstracts Views on Vision4Press platform.
Data correspond to usage on the plateform after 2015. The current usage metrics is available 48-96 hours after online publication and is updated daily on week days.
Initial download of the metrics may take a while.