Fig. B.1
Download original image
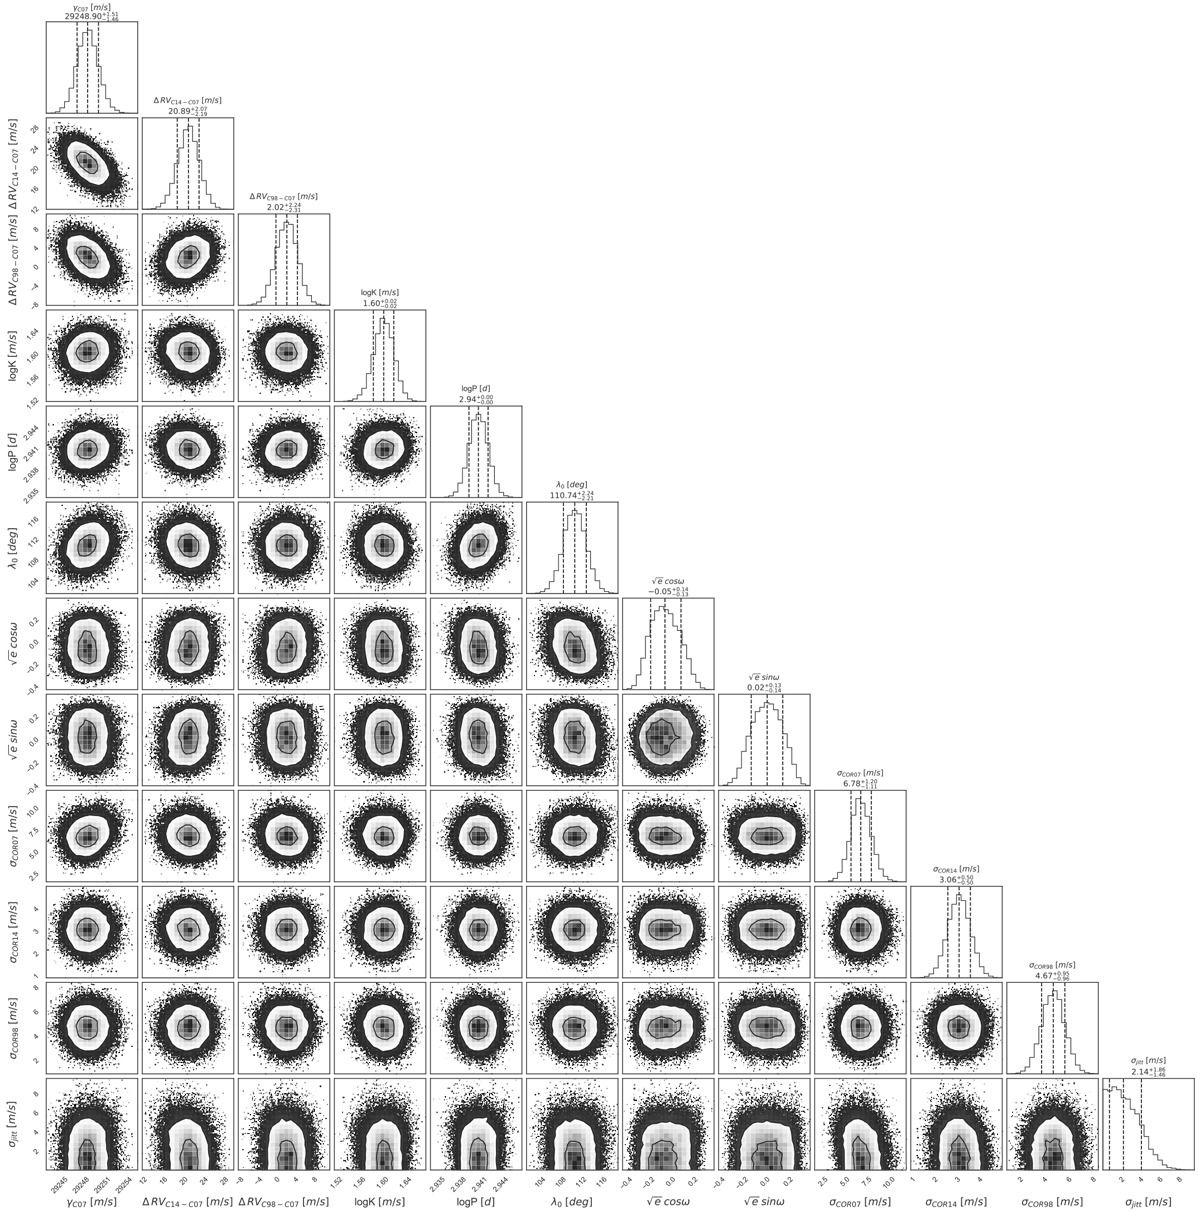
Posterior distributions of fit parameters of HD22532. Each panel contains the two-dimensional histograms of the 1 200 000 samples (after removal of the burn-in, the first 25% of the chains). Contours are drawn to improve the visualization of the 1σ and 2σ confidence interval levels. The upper panels of the corner plot show the probability density distributions of each orbital parameter of the final MCMC sample. The vertical dashed lines mark the 16th, 50th, and 84th percentiles of the overall MCMC samples, delimiting the 1σ confidence interval.
Current usage metrics show cumulative count of Article Views (full-text article views including HTML views, PDF and ePub downloads, according to the available data) and Abstracts Views on Vision4Press platform.
Data correspond to usage on the plateform after 2015. The current usage metrics is available 48-96 hours after online publication and is updated daily on week days.
Initial download of the metrics may take a while.