Fig. 7.
Download original image
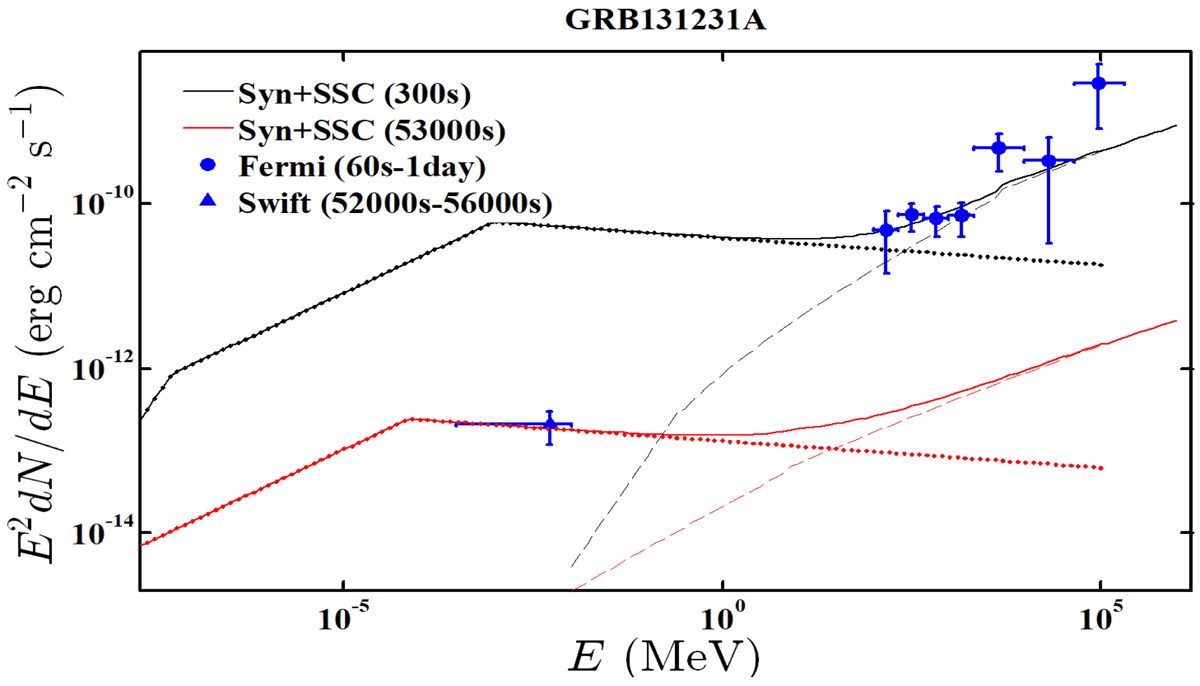
Modelling of broadband spectra of GRB 131231A in the time intervals 60 s-1day and 52 000–56 000 s. Thick black curves represent the theoretical spectra of synchrotron plus SSC corresponding to slow cooling in the external forward shock scenario. Dotted line and dashed line represent the synchrotron and SSC component, respectively. The adopted parameters are ϵe = 0.16, ϵB = 0.00001, p = 2.13, and n = 1 cm−3.
Current usage metrics show cumulative count of Article Views (full-text article views including HTML views, PDF and ePub downloads, according to the available data) and Abstracts Views on Vision4Press platform.
Data correspond to usage on the plateform after 2015. The current usage metrics is available 48-96 hours after online publication and is updated daily on week days.
Initial download of the metrics may take a while.