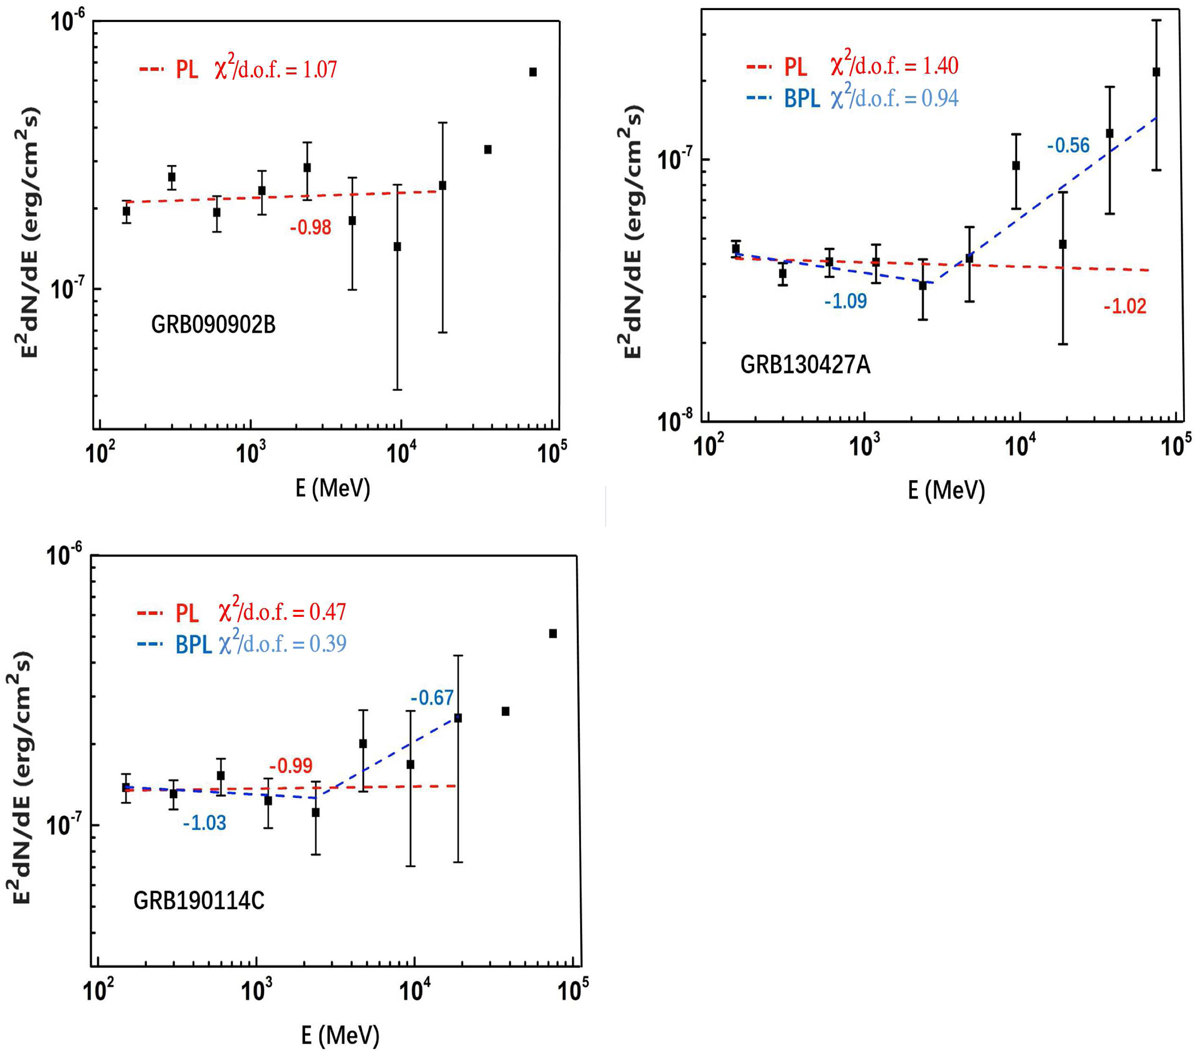
Fig. 6.
Download original image
Spectra F of GRB 090902B, GRB 130427A, and GRB 190114C in the time interval T0 to 2 × T90. The single power-law fits are made starting from 100 MeV and up to where measurements can be fit. Data (squares) without error bars are upper limits, which are calculated assuming Γ = −3 (fixed). The dash lines are the fits of the data points with a PL (red) or BPL (blue) model. The numbers next to the model fits are the index of the spectra F in each energy interval.
Current usage metrics show cumulative count of Article Views (full-text article views including HTML views, PDF and ePub downloads, according to the available data) and Abstracts Views on Vision4Press platform.
Data correspond to usage on the plateform after 2015. The current usage metrics is available 48-96 hours after online publication and is updated daily on week days.
Initial download of the metrics may take a while.