Fig. 3.
Download original image
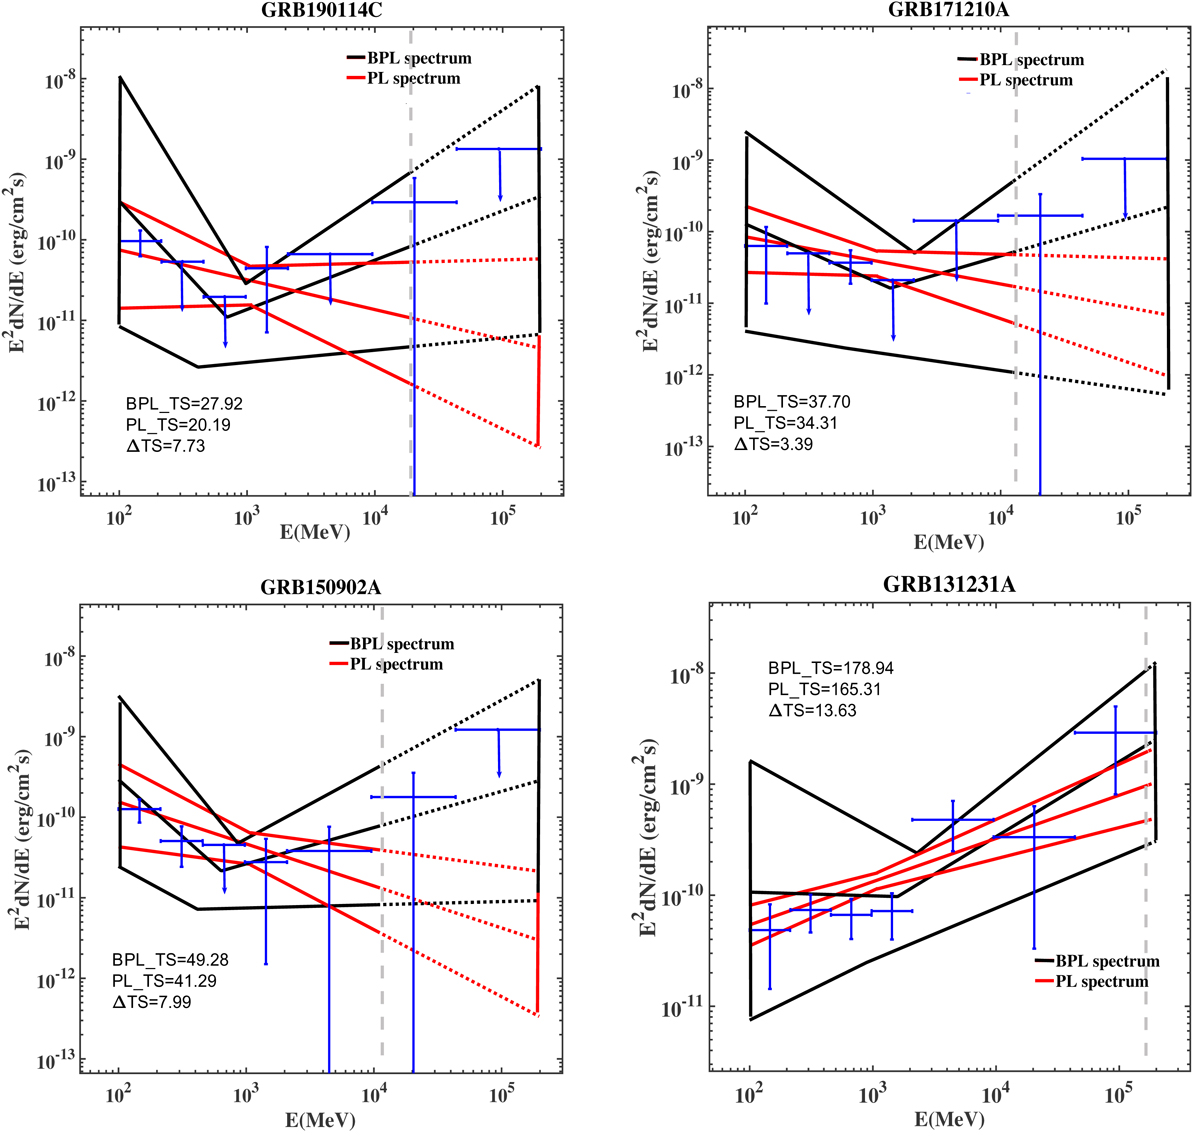
0.1–200 GeV PL and BPL spectra of the 7 GRBs in the E2dN/dE representation, using time range from the 2 × T90 to one day thereafter. Red and black lines show the PL model fits and BPL model fits, respectively. All ±1σ error contours are propagated from errors on the fit parameters. The vertical dashed lines indicate the energy of the most energetic photon detected. The spectra are extrapolated above the maximum photon energy to 200 GeV and are shown as dotted lines. The blue data points are fits with a power law in individual energy bands. The upper limits are calculated with assuming index = −3 (fixed).
Current usage metrics show cumulative count of Article Views (full-text article views including HTML views, PDF and ePub downloads, according to the available data) and Abstracts Views on Vision4Press platform.
Data correspond to usage on the plateform after 2015. The current usage metrics is available 48-96 hours after online publication and is updated daily on week days.
Initial download of the metrics may take a while.