Free Access
Fig. 2.
Download original image
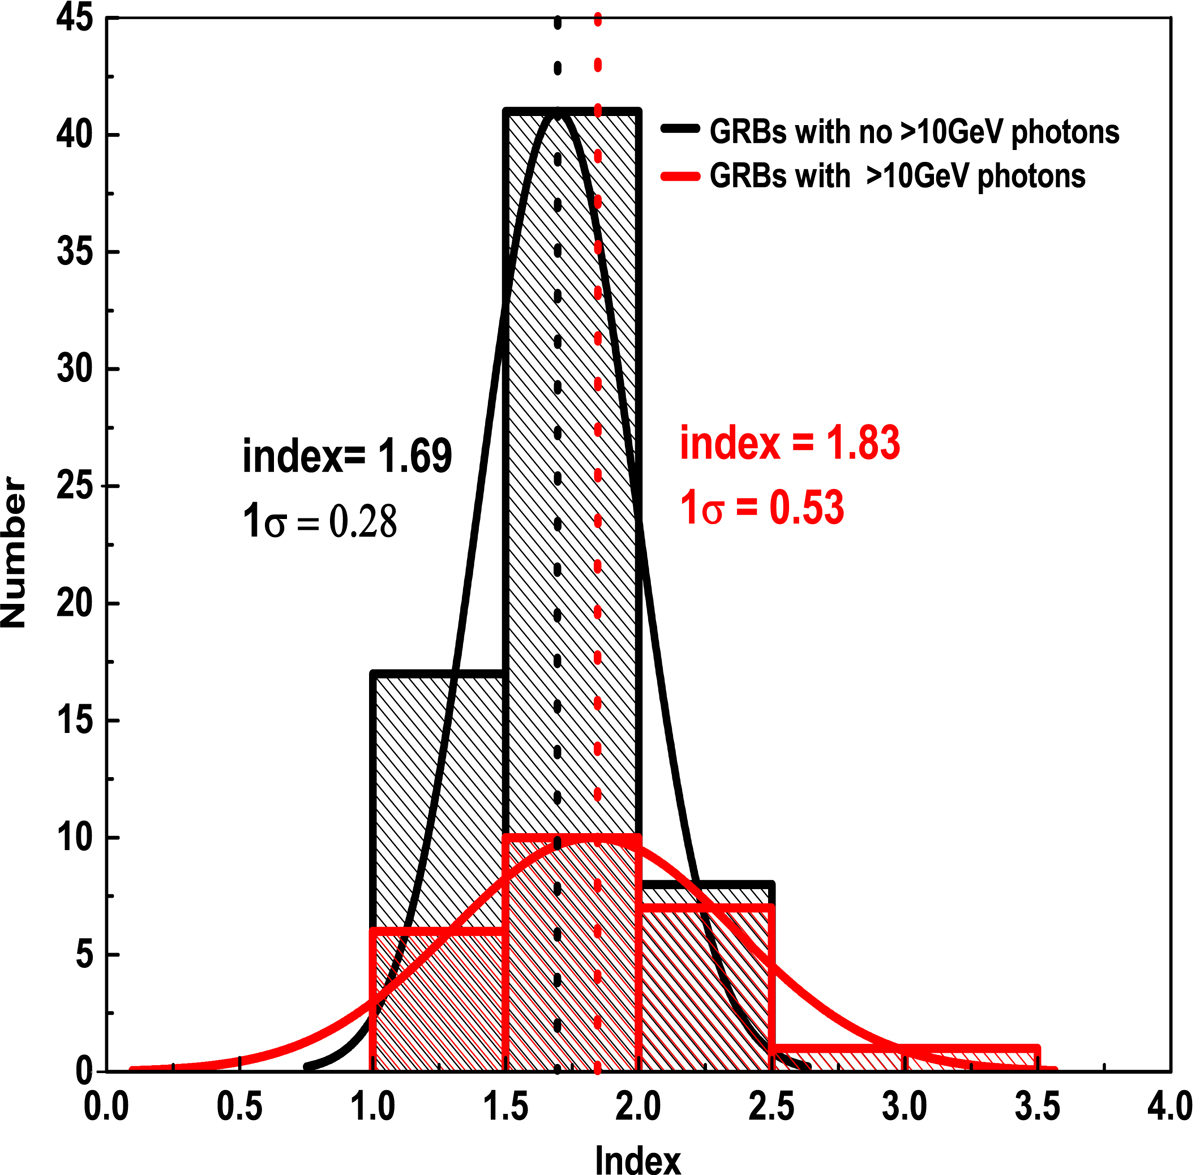
Distribution of spectral index from 174 typical GRB afterglows (black) and the 25 GRBs with ≥10 GeV photons detected (red), respectively. The spectra of afterglows from 2 × T90 to one day are fit with the PL model in 0.1–200 GeV.
Current usage metrics show cumulative count of Article Views (full-text article views including HTML views, PDF and ePub downloads, according to the available data) and Abstracts Views on Vision4Press platform.
Data correspond to usage on the plateform after 2015. The current usage metrics is available 48-96 hours after online publication and is updated daily on week days.
Initial download of the metrics may take a while.