Fig. 9
Download original image
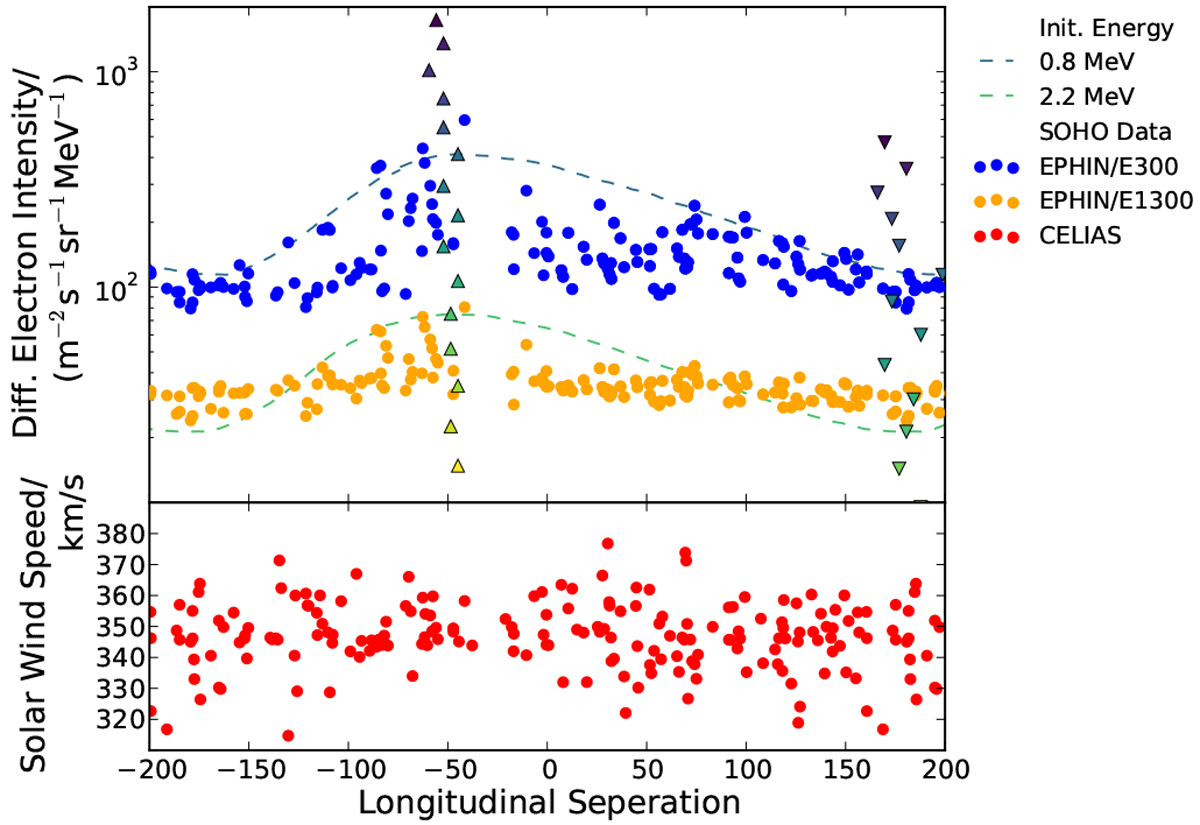
Effect of corotation as shown in Fig. 8 as detected by SOHO-EPHIN. While the upward pointing and downward pointing triangles mark the positions of the maxima and minima of the simulated Jovian fluxes, as shown in the upper panel of Fig. 8, the two electron channels are shown in blue and orange as daily averages sampled over four synodic periods during the 2006–2011 Solar minimum. The simulation results corresponding to initial energies equivalent to those of theelectron channels are shown to match to the envelope of the data. In the lower panel, the corresponding SOHO-CELIAS data points are given for the daily averages of the Solar wind speed. Both panels show their data with respect to the longitudinal separation to the nominal point of best magnetic connection.
Current usage metrics show cumulative count of Article Views (full-text article views including HTML views, PDF and ePub downloads, according to the available data) and Abstracts Views on Vision4Press platform.
Data correspond to usage on the plateform after 2015. The current usage metrics is available 48-96 hours after online publication and is updated daily on week days.
Initial download of the metrics may take a while.