Fig. 7
Download original image
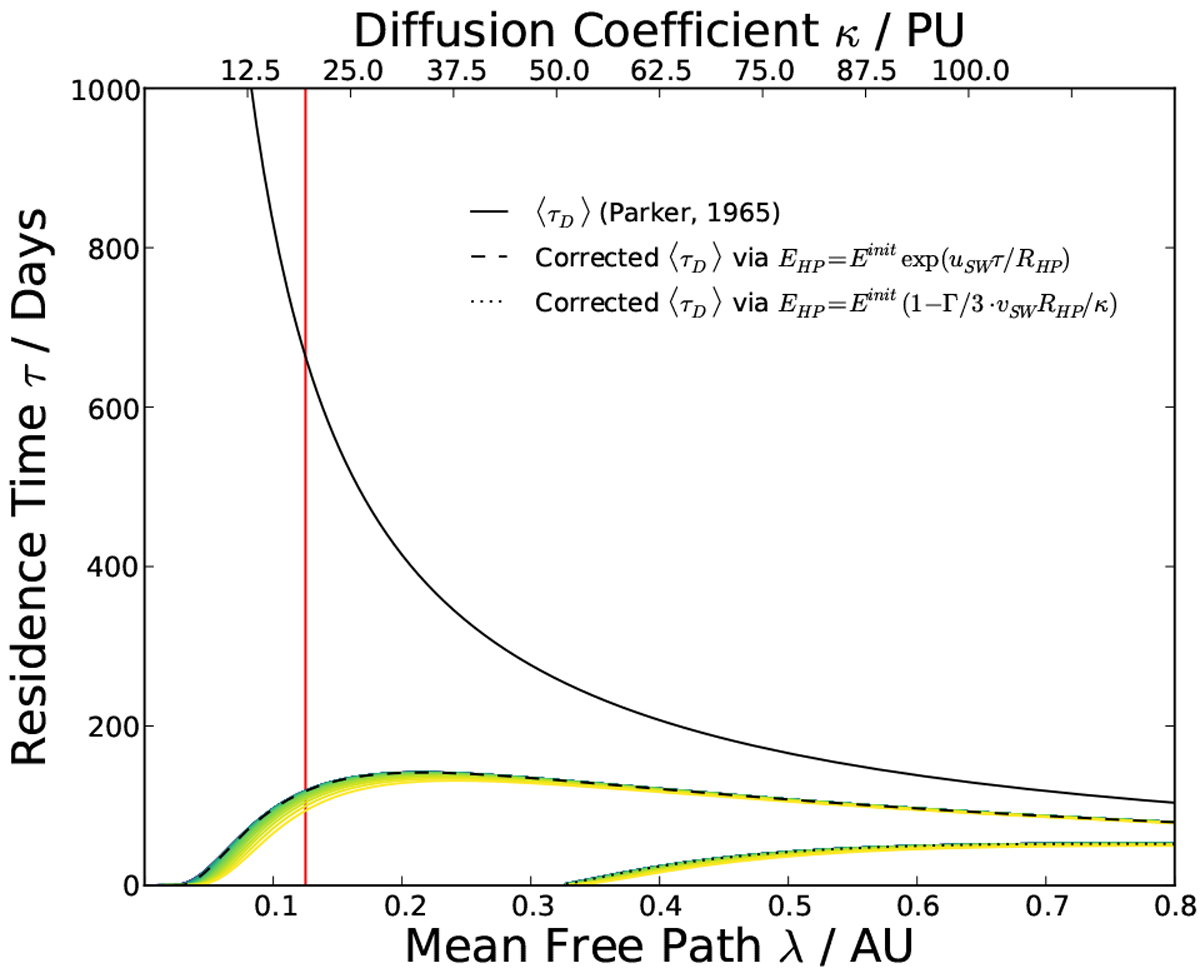
Analytical estimate of the GCR residence time according to Parker (1965) with respect to the assumed mean free path λ (bottom x-axis) and the resulting diffusion coefficient κ (top x-axis).The two dashed lines show the corrected analytical estimates according to the estimations for the adiabatic energy loss by Eqs. (10) and (11), respectively. The resulting residence times are shown, colour coded from blue to yellow, for the whole energy range of the Jovian spectrum (by 30 logarithmically spaced representive energies) as a measure of the uncertainty.
Current usage metrics show cumulative count of Article Views (full-text article views including HTML views, PDF and ePub downloads, according to the available data) and Abstracts Views on Vision4Press platform.
Data correspond to usage on the plateform after 2015. The current usage metrics is available 48-96 hours after online publication and is updated daily on week days.
Initial download of the metrics may take a while.