Fig. 6
Download original image
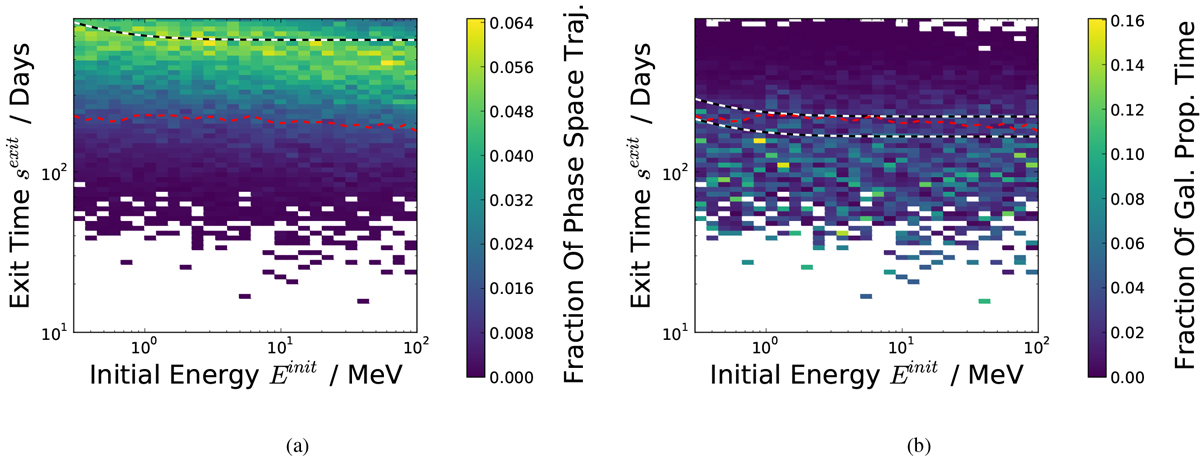
Similar to Fig. 5, but for trajectories exiting at the outer boundary are shown instead of the Jovian magnetosphere. Left panel: distribution of unweighted exit times
![]() of trajectories exiting at the outer boundary. We note that the maxima are in loose agreement with the analytical estimation as suggested by Parker (1965) given by the dashed white and black line. Right panel: influence of weighting with Eq. (8) together with the numerical solution indicated in red and two estimations of the revised analytical solution given by Eq. (14).
of trajectories exiting at the outer boundary. We note that the maxima are in loose agreement with the analytical estimation as suggested by Parker (1965) given by the dashed white and black line. Right panel: influence of weighting with Eq. (8) together with the numerical solution indicated in red and two estimations of the revised analytical solution given by Eq. (14).
Current usage metrics show cumulative count of Article Views (full-text article views including HTML views, PDF and ePub downloads, according to the available data) and Abstracts Views on Vision4Press platform.
Data correspond to usage on the plateform after 2015. The current usage metrics is available 48-96 hours after online publication and is updated daily on week days.
Initial download of the metrics may take a while.