Fig. 2
Download original image
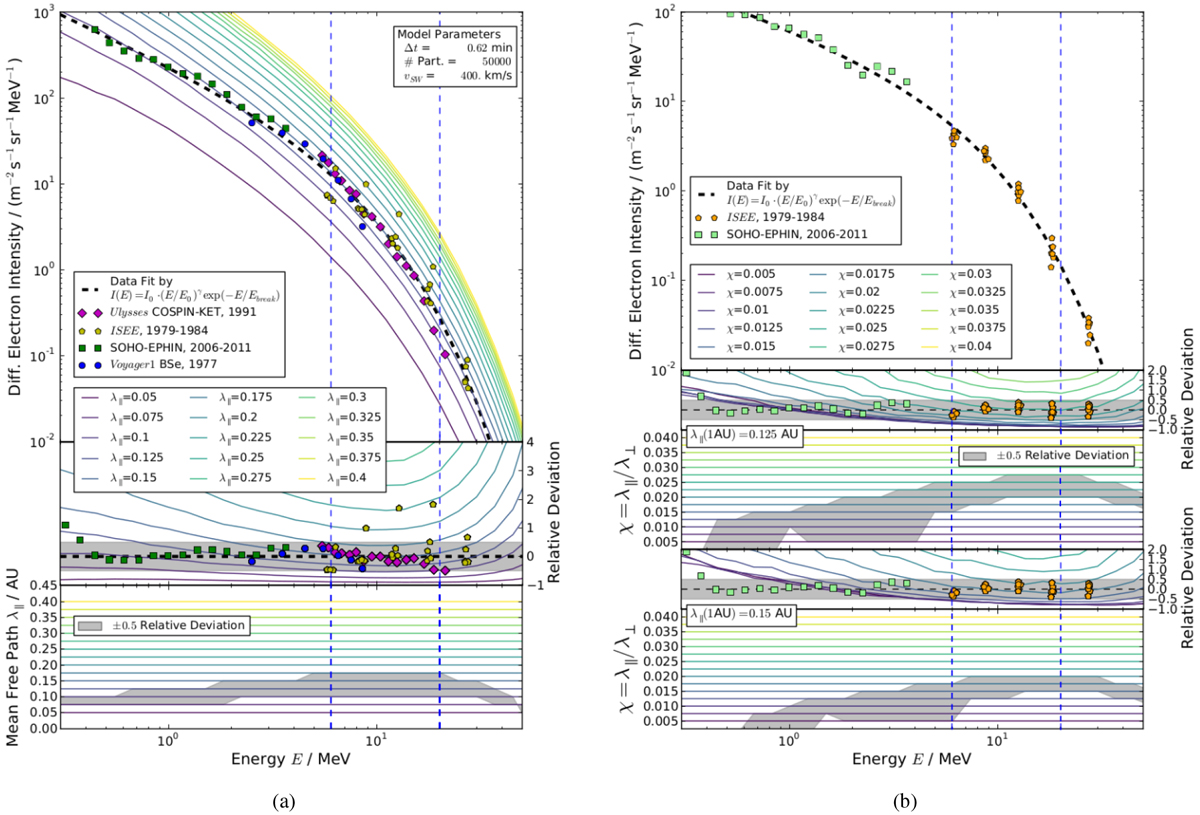
Simulated Jovian electron spectra, similar to the figures by Vogt et al. (2020), but covering the whole energy range of the Jovian source where the energy range previously investigated by Vogt et al. (2020) is indicated by the two dashed blue lines. Top of the left panel: Earth orbit spectral data in the case of good connection to the source alongside with a data fit (dashed black line). The simulation results for different values of λ∥ = [0.05, 0.4] AU are colour coded. Middle panel: Fig. 2a shows the corresponding relative deviation to the source spectrum for both data and simulation results, with the area of a ± 0.5 deviationindicated in grey. Bottom panel: resulting energy dependence of the parallel mean free path. The right panel displays the corresponding results for different values of χ = [0, 0005, 0.045] in the case of a bad connection. Again, the top panels show the Earth orbit spectral data alongside a data fit indicated in a dashed black line. The relative deviations and resulting energy dependencies are shown for λ∥ = 0.125 AU (second and third panel) and λ∥ = 0.15 AU (fourth and fifth panel).
Current usage metrics show cumulative count of Article Views (full-text article views including HTML views, PDF and ePub downloads, according to the available data) and Abstracts Views on Vision4Press platform.
Data correspond to usage on the plateform after 2015. The current usage metrics is available 48-96 hours after online publication and is updated daily on week days.
Initial download of the metrics may take a while.