Fig. 1
Download original image
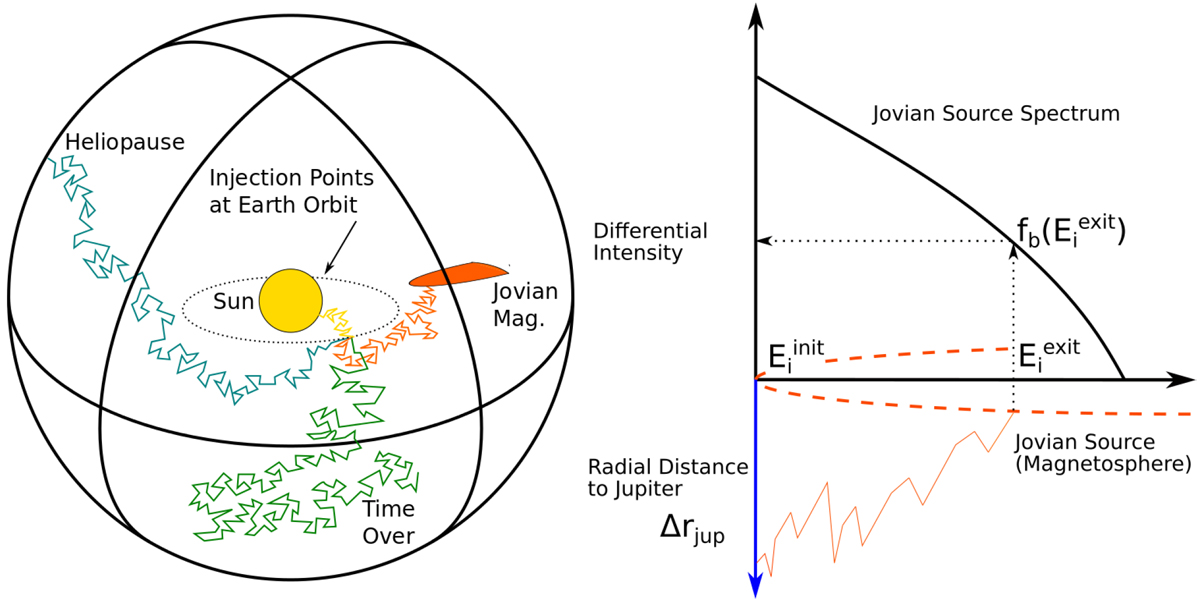
Simulation setup according to Vogt et al. (2020). On the right side, a visualisation is shown of how the Jovian source spectrum determines the resulting differential intensity. The sketch thereby is to be read from bottom to top. The pseudo-particle was injected with an initial energy
![]() at a certain distance from the Jovian source. When the pseudo-particle’s phase-space trajectory hit the source (the dashed representation of the Jovian magnetosphere) with an exit energy
at a certain distance from the Jovian source. When the pseudo-particle’s phase-space trajectory hit the source (the dashed representation of the Jovian magnetosphere) with an exit energy
![]() , it was convoluted with the source spectrum as the boundary condition. Subsequently the differential intensity was calculated as
, it was convoluted with the source spectrum as the boundary condition. Subsequently the differential intensity was calculated as![]() . The dashed representation of the Jovian magnetosphere only serves an illustrative purpose.
. The dashed representation of the Jovian magnetosphere only serves an illustrative purpose.
Current usage metrics show cumulative count of Article Views (full-text article views including HTML views, PDF and ePub downloads, according to the available data) and Abstracts Views on Vision4Press platform.
Data correspond to usage on the plateform after 2015. The current usage metrics is available 48-96 hours after online publication and is updated daily on week days.
Initial download of the metrics may take a while.