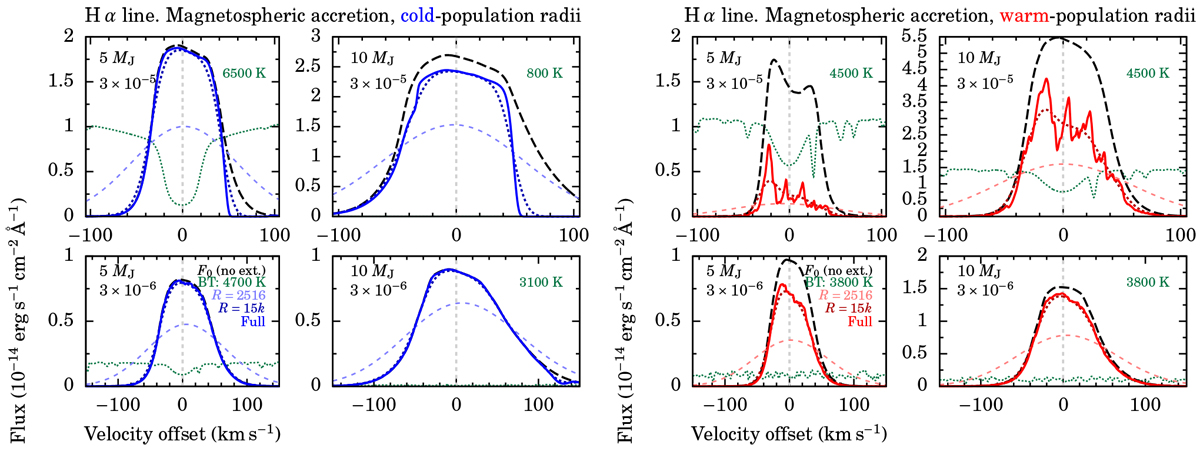
Fig. 8
Download original image
As in Fig. 6, but for the MagAcc cases (cold and warm; left and right groups, respectively). The mass in MJ and accretion rate in MJ yr−1 are indicated in each subpanel. The spectra are for an observer looking into the accretion flow towards the base of the shock or more generally for radiation passing through only the layers closest to the planet and escaping (see Fig. 1). Possible rotation and inclination (between the observer and the accretion column) are not taken into account. The strong photospheric absorption (green) in some cases may not be realistic; see text.
Current usage metrics show cumulative count of Article Views (full-text article views including HTML views, PDF and ePub downloads, according to the available data) and Abstracts Views on Vision4Press platform.
Data correspond to usage on the plateform after 2015. The current usage metrics is available 48-96 hours after online publication and is updated daily on week days.
Initial download of the metrics may take a while.