Fig. 6
Download original image
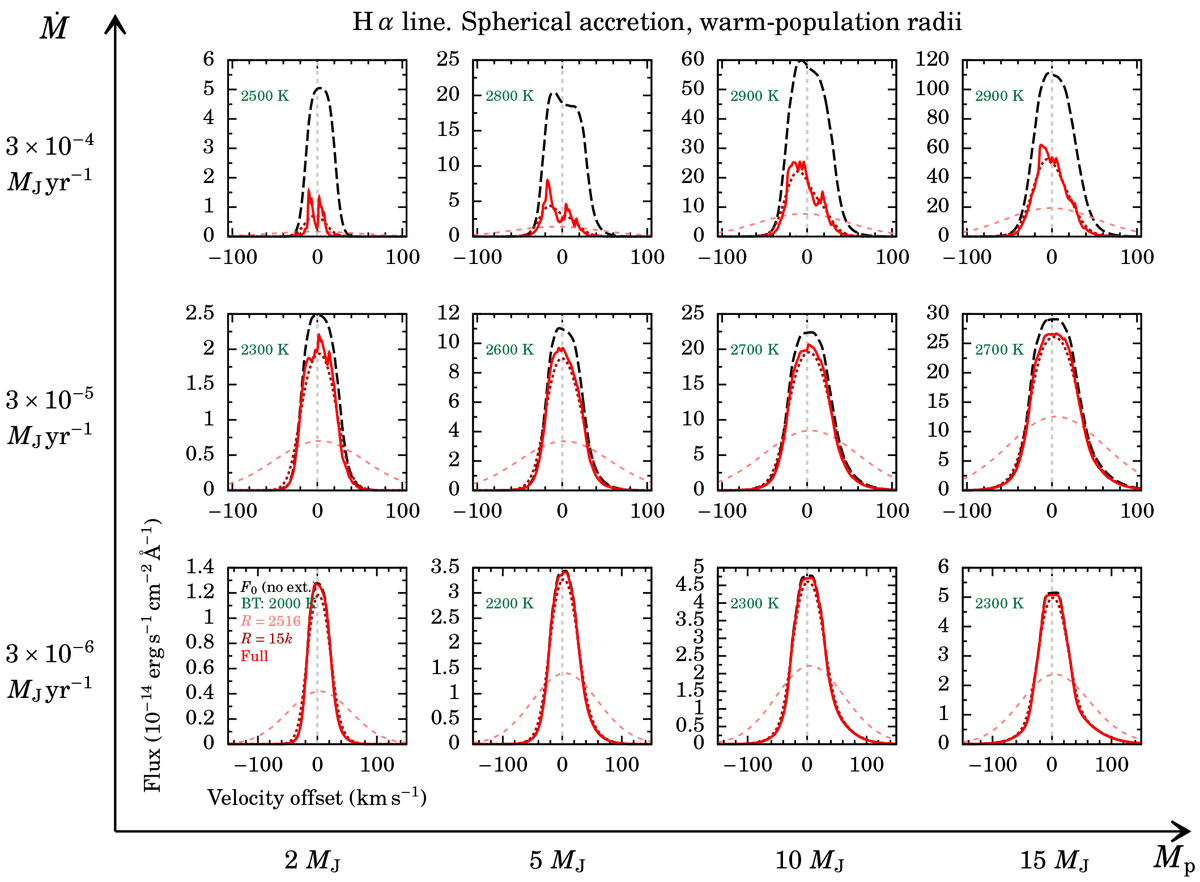
Effect of the extinction by the accreting gas on the H α profile. Shown is the flux for sources at 150 pc as a function of planet mass and accretion rate (outer axes) for the SpherAcc-Warm case of Table 1. For each subpanel, we plot the profile without extinction (black dashed line) and the profile after passing through the accreting material (red solid line). No ISM absorption is considered. The observable profiles are also shown convolved with the resolution of MUSE (R = 2516; dashed pale red line), and of VIS-X (R = 15, 000; dashed dark red line). The heated photosphere (BT-Settl model, with Teff from the fit of Aoyama et al. 2020; green dotted line and label) is too weak to be seen in any panel. The horizontal axes are the velocity offset from the line centre. The flux and velocity ranges differ from panel to panel.
Current usage metrics show cumulative count of Article Views (full-text article views including HTML views, PDF and ePub downloads, according to the available data) and Abstracts Views on Vision4Press platform.
Data correspond to usage on the plateform after 2015. The current usage metrics is available 48-96 hours after online publication and is updated daily on week days.
Initial download of the metrics may take a while.