Fig. 4

Download original image
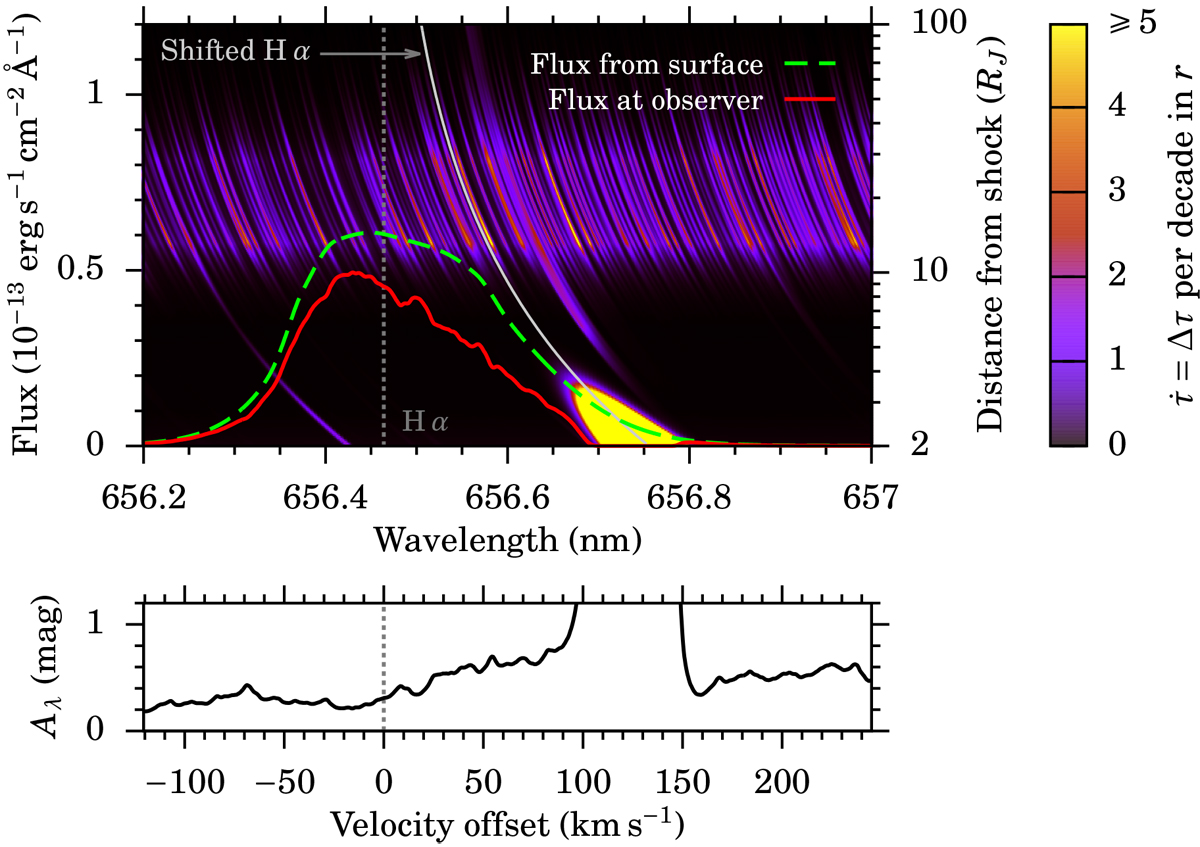
Top panel: H α line profile at spectral resolution R = 1.5 × 10⁶ for one case in the Polar-Cold scenario with Ṁ = 3 × 10⁻⁵ MJ yr−1, Mp = 10 MJ, and Rp = 2.04 RJ (solid red line) when observing into the accreting area at 150 pc. The flux in the absence of absorption by the incoming matter is also shown (dashed green line). The background colour shows as a function of distance from the planet (right vertical axis) and observer-frame wavelength the strength of the absorption by the gas
![]() (Eq. (16)), capped at
(Eq. (16)), capped at ![]() . Few regions have a higher
. Few regions have a higher ![]() , the main onebeing the H I resonance near the shock (reaching
, the main onebeing the H I resonance near the shock (reaching ![]() ). Indicated are also the central peak of the H α line in the rest frame λH α (vertical dotted grey line) and, as a function of radial distance from the planet, the wavelength that becomes blueshifted to λH α (see Eq. (15); curved solid grey line). No dust nor ISM extinction is included. Over the brighter region at r = 15–30 RJ, the temperature is T ≈ 2000–1500 K and the pressure P ≈ 1–0.2 erg cm−3 (cf. Fig. 3). Bottom panel: extinction Aλ from the accretion flow against velocity offset relative to H α.
). Indicated are also the central peak of the H α line in the rest frame λH α (vertical dotted grey line) and, as a function of radial distance from the planet, the wavelength that becomes blueshifted to λH α (see Eq. (15); curved solid grey line). No dust nor ISM extinction is included. Over the brighter region at r = 15–30 RJ, the temperature is T ≈ 2000–1500 K and the pressure P ≈ 1–0.2 erg cm−3 (cf. Fig. 3). Bottom panel: extinction Aλ from the accretion flow against velocity offset relative to H α.
Current usage metrics show cumulative count of Article Views (full-text article views including HTML views, PDF and ePub downloads, according to the available data) and Abstracts Views on Vision4Press platform.
Data correspond to usage on the plateform after 2015. The current usage metrics is available 48-96 hours after online publication and is updated daily on week days.
Initial download of the metrics may take a while.


