Fig. 2
Download original image
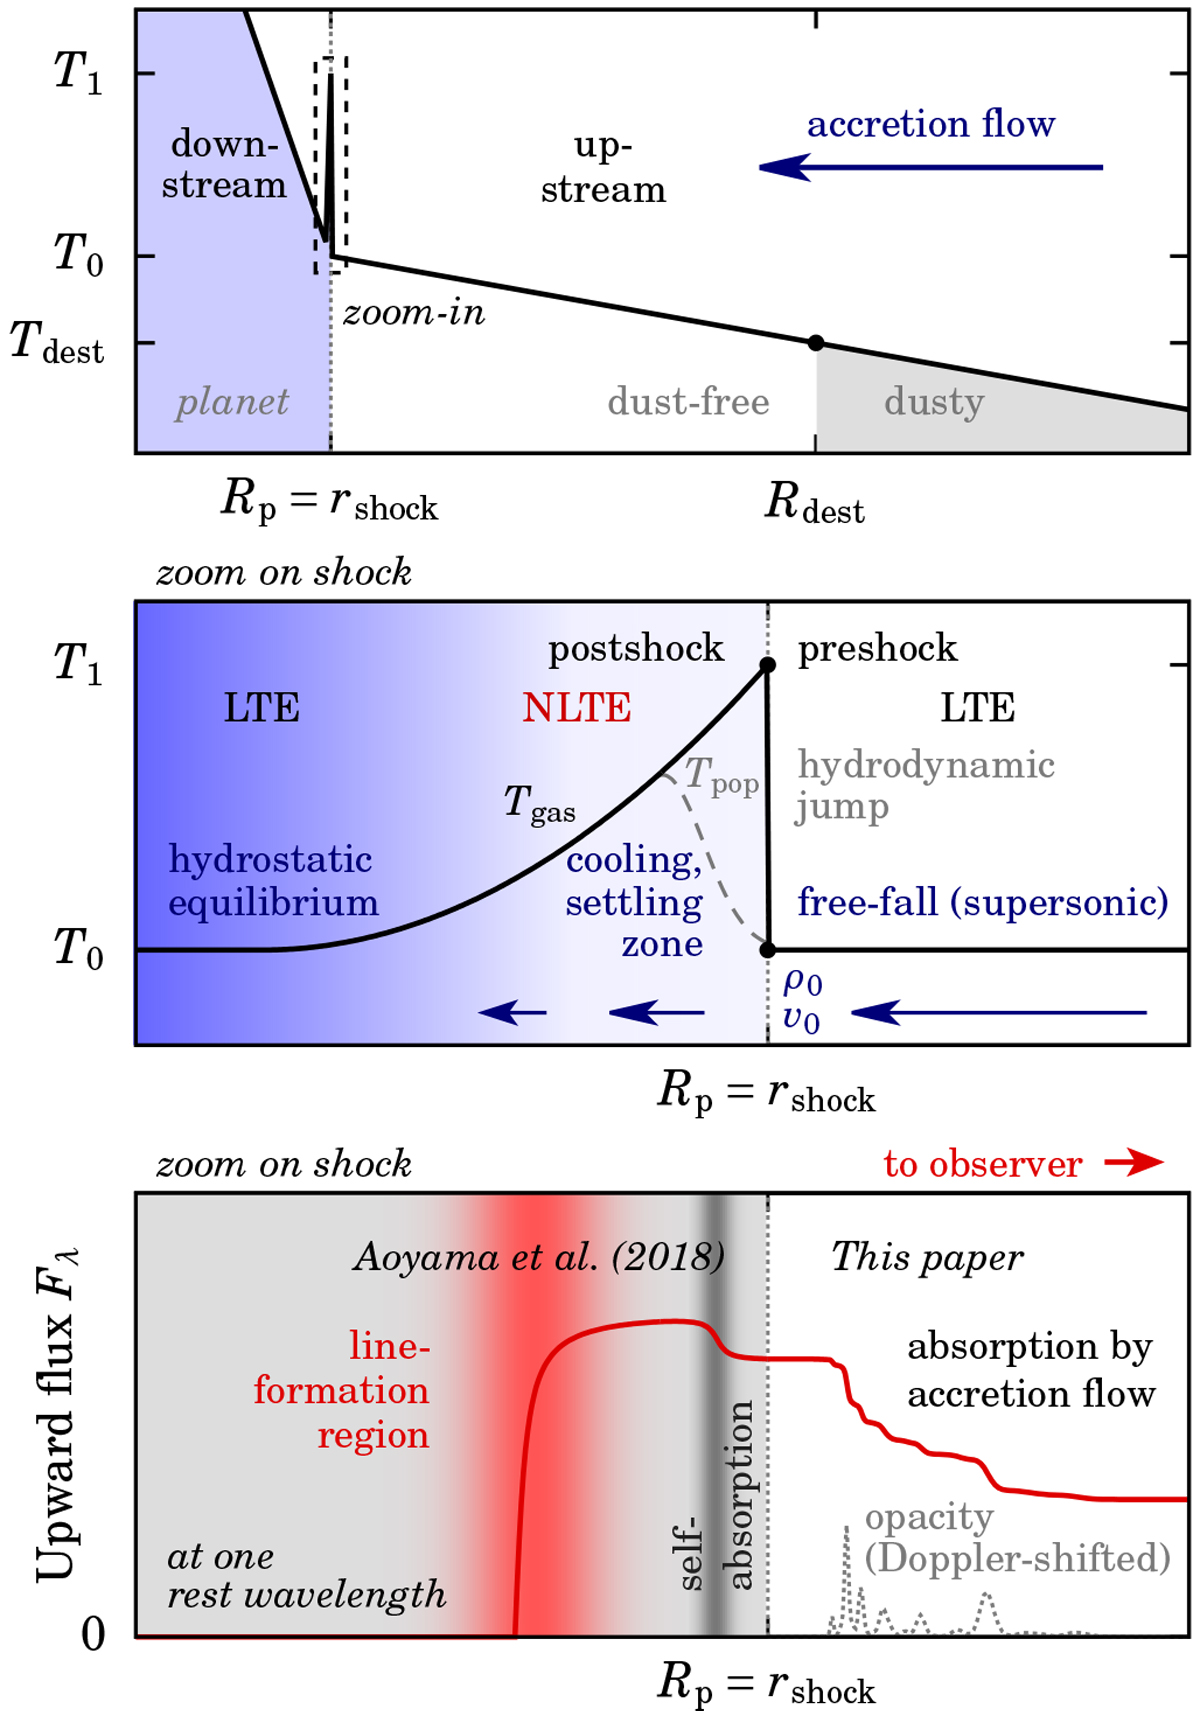
Overview of the structure of the accretion flow and of the shock region (see labels). Top panel: temperature (double logarithmic scale), showing the shock temperature T0, the Zel’dovich spike up to T ≈ T1, and the dust destruction front at radius Rdest. The shock defines the planet’s radius. The temperature flattening at T ≈ Tdest (e.g. Marleau et al. 2019) is not shown. The next two panels focus on the dashed box. Middle panel: temperature near the shock on a linear scale. Below the hydrodynamic jump, in the NLTE cooling and settling zone, the “population temperature” of the electrons Tpop and the kinetic temperature Tgas differ at first. The temperature structure is simplified; Fig. 8 of Vaytet et al. (2013b) gives a more accurate schematic. Bottom panel: upward-moving flux at one restframe wavelength within the H α line (red line), from the microphysical models of Aoyama et al. (2018). We illustrate the line-formation region (red) and the self-absorption (dark grey) in the settling zone, and the absorption by the accretion flow, calculated in this work. The features in the opacity (dotted grey curve; arbitrary linear scale) come from the Doppler-shift gradient (Eq. (15); Fig. 4).
Current usage metrics show cumulative count of Article Views (full-text article views including HTML views, PDF and ePub downloads, according to the available data) and Abstracts Views on Vision4Press platform.
Data correspond to usage on the plateform after 2015. The current usage metrics is available 48-96 hours after online publication and is updated daily on week days.
Initial download of the metrics may take a while.