Fig. 10
Download original image
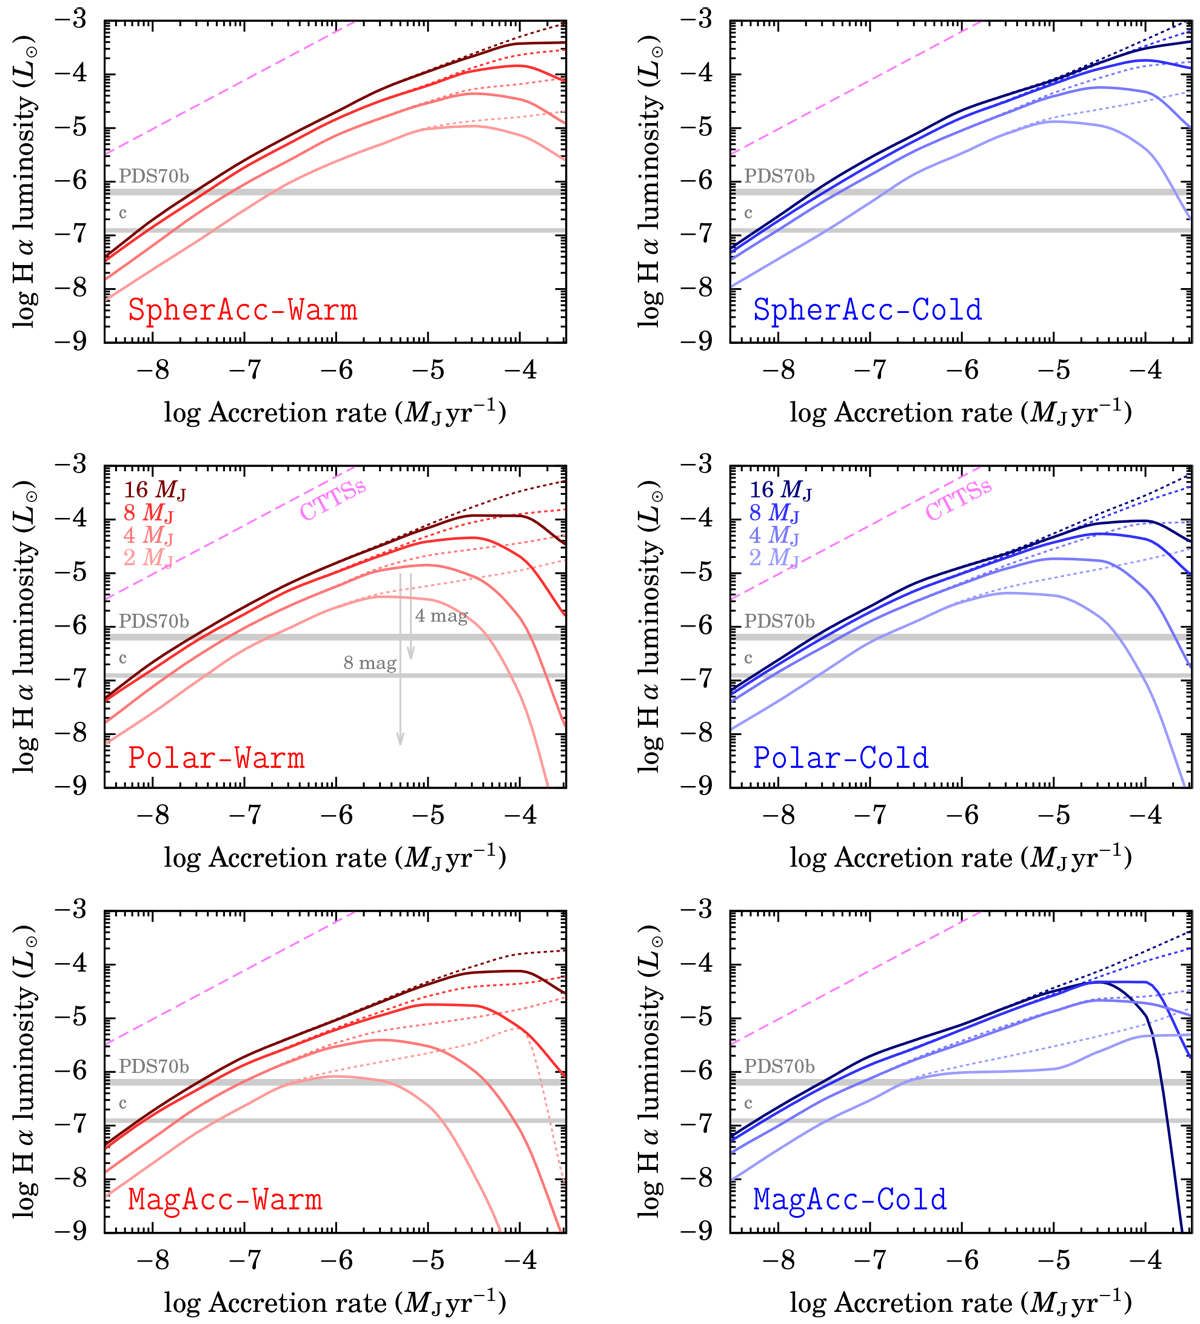
Absorption-modified relationship (solid curves) between H α luminosity and accretion rate for the warm- (left panel) and cold-population (right panel) radius fits for the three accretion geometries (rows; see labels). We consider only absorption by the gas,and also show the case of no absorption (dotted curves). Curves are for masses of 2–16 MJ (bottom to top, but with an inversion in MagAcc-Cold at very high Ṁ). Horizontal bands are for the luminosity of PDS 70 b (Zhou et al. 2021) and PDS 70 c (Hashimoto et al. 2020). The fit of Ingleby et al. (2013) for CTTSs is also shown (pink dashed line). For reference, one panel shows extinction arrows for AH α = 4 and 8 mag.
Current usage metrics show cumulative count of Article Views (full-text article views including HTML views, PDF and ePub downloads, according to the available data) and Abstracts Views on Vision4Press platform.
Data correspond to usage on the plateform after 2015. The current usage metrics is available 48-96 hours after online publication and is updated daily on week days.
Initial download of the metrics may take a while.