Fig. 3.
Download original image
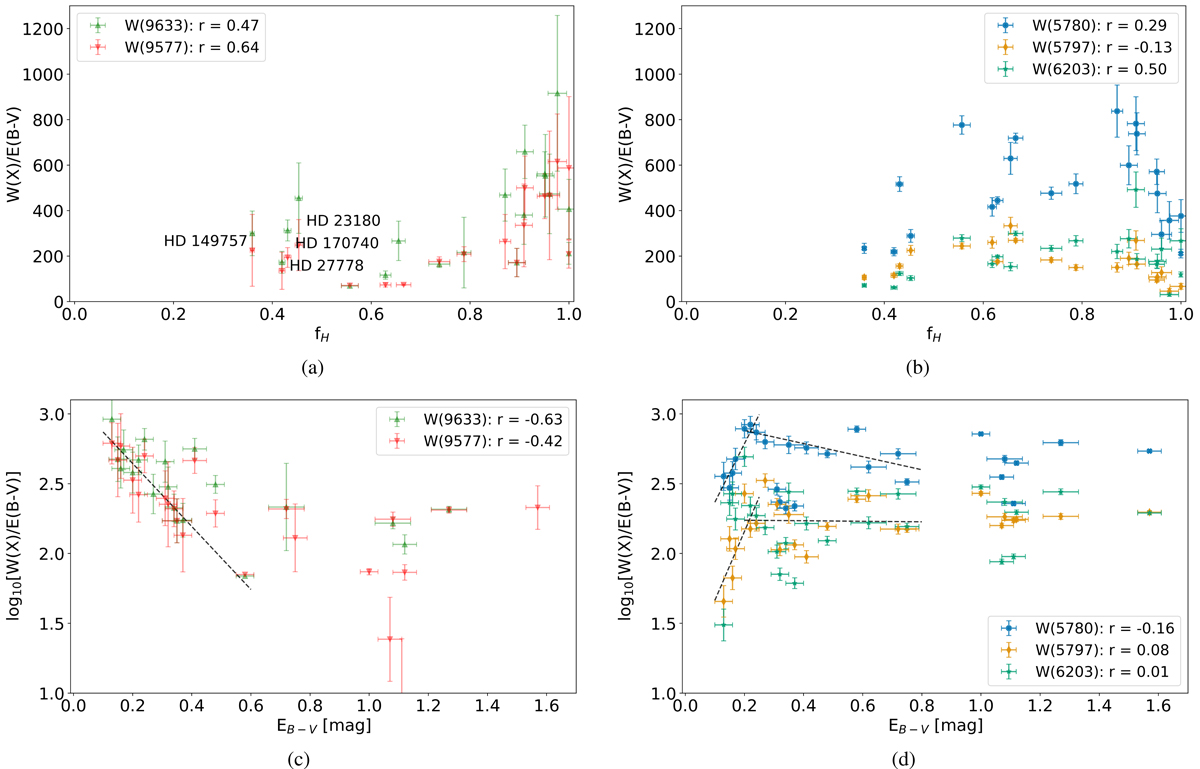
Correlation studies for the C![]() bands. The normalised EWs of the two C
bands. The normalised EWs of the two C![]() DIBs and the DIBs at 6203, 5780, and 5797 Å are plotted against the fraction of neutral hydrogen fH (top) and the colour excess EB − V (bottom). We note the very specific behaviour of C
DIBs and the DIBs at 6203, 5780, and 5797 Å are plotted against the fraction of neutral hydrogen fH (top) and the colour excess EB − V (bottom). We note the very specific behaviour of C![]() compared to other DIB carriers. (a) Normalised EWs of the C
compared to other DIB carriers. (a) Normalised EWs of the C![]() DIBs as functions of fH. (b) Normalised EWs of the other DIBs as functions of fH. (c) Normalised EWs of the C
DIBs as functions of fH. (b) Normalised EWs of the other DIBs as functions of fH. (c) Normalised EWs of the C![]() DIBs as functions of EB − V. (d) Normalised EWs of the other DIBs as functions of EB − V.
DIBs as functions of EB − V. (d) Normalised EWs of the other DIBs as functions of EB − V.
Current usage metrics show cumulative count of Article Views (full-text article views including HTML views, PDF and ePub downloads, according to the available data) and Abstracts Views on Vision4Press platform.
Data correspond to usage on the plateform after 2015. The current usage metrics is available 48-96 hours after online publication and is updated daily on week days.
Initial download of the metrics may take a while.